|
Download Data (XLS File) |
|
||||||||
|
||||||||
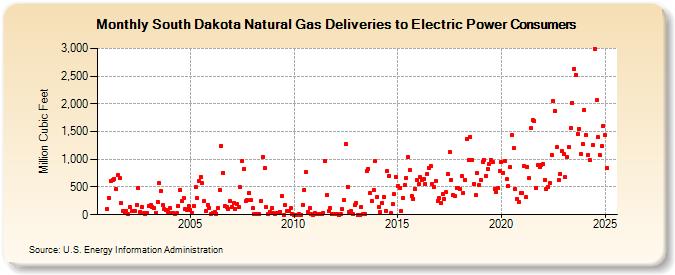
| South Dakota Natural Gas Deliveries to Electric Power Consumers (Million Cubic Feet) | ||||||||
| Year | Jan | Feb | Mar | Apr | May | Jun | Jul | Aug | Sep | Oct | Nov | Dec |
|---|---|---|---|---|---|---|---|---|---|---|---|---|
| 2001 | 107 | 302 | 600 | 632 | 652 | 455 | 711 | 666 | 211 | 61 | 29 | 70 |
| 2002 | 9 | 145 | 61 | 62 | 58 | 182 | 480 | 55 | 148 | 27 | 12 | 25 |
| 2003 | 157 | 173 | 135 | 122 | 39 | 232 | 569 | 423 | 175 | 95 | 90 | 54 |
| 2004 | 115 | 24 | 31 | 10 | 26 | 160 | 447 | 246 | 293 | 95 | 78 | 151 |
| 2005 | 94 | 36 | 163 | 495 | 293 | 616 | 686 | 567 | 247 | 66 | 181 | 124 |
| 2006 | 20 | 36 | 45 | 21 | 126 | 454 | 1,244 | 759 | 152 | 133 | 112 | 242 |
| 2007 | 142 | 204 | 104 | 190 | 146 | 493 | 966 | 832 | 241 | 262 | 392 | 265 |
| 2008 | 115 | 17 | 12 | 13 | 16 | 247 | 1,050 | 846 | 134 | 8 | 56 | 118 |
| 2009 | 27 | 7 | 29 | 24 | 49 | 337 | 1 | 175 | 69 | 67 | 117 | 17 |
| 2010 | 1 | 1 | 1 | 14 | 3 | 176 | 449 | 765 | 50 | 128 | 10 | 3 |
| 2011 | 22 | 7 | 6 | 4 | 11 | 31 | 967 | 352 | 61 | 115 | 5 | 9 |
| 2012 | 4 | 6 | 2 | 21 | 95 | 257 | 1,276 | 508 | 52 | 67 | 6 | 169 |
| 2013 | 219 | 2 | 2 | 142 | 12 | 15 | 787 | 831 | 399 | 248 | 451 | 963 |
| 2014 | 326 | 146 | 46 | 207 | 317 | 74 | 782 | 704 | 24 | 186 | 366 | 687 |
| 2015 | 516 | 484 | 66 | 301 | 535 | 664 | 1,040 | 809 | 339 | 291 | 463 | 622 |
| 2016 | 545 | 674 | 629 | 642 | 558 | 739 | 849 | 871 | 546 | 499 | 607 | 252 |
| 2017 | 294 | 216 | 372 | 283 | 405 | 731 | 1,132 | 635 | 357 | 335 | 476 | 477 |
| 2018 | 470 | 692 | 394 | 625 | 1,363 | 982 | 1,407 | 989 | 554 | 347 | 745 | 533 |
| 2019 | 627 | 951 | 994 | 700 | 827 | 910 | 993 | 949 | 468 | 407 | 481 | 794 |
| 2020 | 942 | 761 | 967 | 644 | 516 | 857 | 1,436 | 1,198 | 466 | 291 | 233 | 393 |
| 2021 | 384 | 872 | 311 | 863 | 656 | 1,557 | 1,710 | 1,689 | 482 | 891 | 864 | 901 |
| 2022 | 904 | 601 | W | W | 616 | W | 1,252 | 1,276 | 971 | 681 | 643 | 904 |
| 2023 | 1,087 | 674 | 1,034 | 1,217 | 1,562 | 2,024 | 2,630 | 2,529 | 1,458 | 1,553 | 1,089 | 1,273 |
| 2024 | 1,860 | 1,486 | 1,091 | 1,230 | W | W | ||||||
| - = No Data Reported; -- = Not Applicable; NA = Not Available; W = Withheld to avoid disclosure of individual company data. |
| Release Date: 8/30/2024 |
| Next Release Date: 9/30/2024 |