|
Download Data (XLS File) |
|
||||||||
|
||||||||
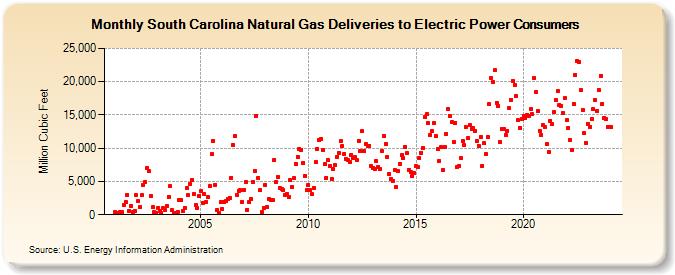
| South Carolina Natural Gas Deliveries to Electric Power Consumers (Million Cubic Feet) | ||||||||
| Year | Jan | Feb | Mar | Apr | May | Jun | Jul | Aug | Sep | Oct | Nov | Dec |
|---|---|---|---|---|---|---|---|---|---|---|---|---|
| 2001 | 357 | 252 | 321 | 362 | 371 | 1,430 | 1,906 | 2,993 | 602 | 1,337 | 477 | 534 |
| 2002 | 2,954 | 2,014 | 1,160 | 2,915 | 4,535 | 4,924 | 7,032 | 6,603 | 2,795 | 1,101 | 396 | 279 |
| 2003 | 986 | 514 | 290 | 980 | 738 | 1,354 | 2,706 | 4,278 | 651 | 304 | 235 | 445 |
| 2004 | 2,187 | 2,171 | 595 | 1,052 | 4,032 | 2,908 | 4,599 | 5,291 | 3,150 | 1,431 | 1,083 | 2,768 |
| 2005 | 3,544 | 1,827 | 3,077 | 1,949 | 2,681 | 4,328 | 9,079 | 11,146 | 4,526 | 695 | 278 | 1,881 |
| 2006 | 844 | 1,836 | 2,046 | 2,299 | 2,545 | 5,577 | 10,531 | 11,785 | 3,011 | 3,616 | 3,683 | 1,942 |
| 2007 | 3,733 | 4,922 | 777 | 1,903 | 2,385 | 4,881 | 6,622 | 14,881 | 5,526 | 3,651 | 434 | 994 |
| 2008 | 4,478 | 1,160 | 2,415 | 2,280 | 2,280 | 8,292 | 4,918 | 5,684 | 4,048 | 3,887 | 3,707 | 3,006 |
| 2009 | 3,159 | 2,726 | 5,174 | 4,234 | 5,507 | 7,696 | 8,679 | 9,942 | 9,798 | 7,793 | 5,890 | 3,704 |
| 2010 | 4,465 | 3,717 | 3,087 | 4,040 | 7,860 | 9,932 | 11,253 | 11,420 | 9,688 | 7,610 | 5,583 | 8,175 |
| 2011 | 7,329 | 5,371 | 6,884 | 7,433 | 8,720 | 9,288 | 11,017 | 10,331 | 9,192 | 8,435 | 8,170 | 7,974 |
| 2012 | 9,050 | 8,578 | 8,614 | 8,175 | 11,140 | 9,540 | 12,522 | 9,644 | 10,620 | 10,395 | 10,398 | 7,333 |
| 2013 | 7,022 | 6,933 | 8,067 | 7,184 | 6,834 | 9,645 | 11,835 | 10,638 | 8,680 | 6,146 | 5,401 | 5,131 |
| 2014 | 6,730 | 4,231 | 6,547 | 7,676 | 8,914 | 8,498 | 10,246 | 9,243 | 6,778 | 6,374 | 5,815 | 6,278 |
| 2015 | 7,267 | 7,181 | 8,512 | 9,328 | 10,045 | 14,729 | 15,096 | 13,804 | 11,970 | 12,523 | 13,807 | 11,849 |
| 2016 | 9,858 | 8,074 | 10,113 | 6,711 | 10,114 | 12,181 | 15,823 | 14,823 | 13,967 | 10,979 | 13,842 | 7,162 |
| 2017 | 7,393 | 8,466 | 11,103 | 10,435 | 13,255 | 11,530 | 13,418 | 12,930 | 12,960 | 12,565 | 11,107 | 10,381 |
| 2018 | 11,714 | 7,360 | 10,714 | 9,136 | 11,654 | 16,625 | 20,491 | 19,933 | 21,711 | 16,842 | 16,343 | 10,995 |
| 2019 | 12,904 | 12,847 | 11,950 | 12,648 | 16,000 | 17,306 | 20,142 | 19,554 | 17,776 | 14,211 | 13,091 | 14,431 |
| 2020 | 14,869 | 14,562 | 15,027 | 14,884 | 15,829 | 15,065 | 20,582 | 18,434 | 15,578 | 12,656 | 12,001 | 13,411 |
| 2021 | 13,122 | 10,626 | 9,485 | 14,150 | 13,569 | 15,378 | 17,179 | 18,604 | 16,541 | 16,391 | 15,325 | 17,561 |
| 2022 | 14,231 | 13,101 | 11,269 | 9,735 | 16,680 | 21,005 | 23,101 | 22,977 | 18,675 | 15,760 | 12,228 | 10,834 |
| 2023 | 13,649 | 13,222 | 14,375 | 15,816 | 17,247 | 15,662 | 18,740 | 20,899 | 16,707 | 14,581 | 14,342 | 13,226 |
| 2024 | 13,221 | |||||||||||
| - = No Data Reported; -- = Not Applicable; NA = Not Available; W = Withheld to avoid disclosure of individual company data. |
| Release Date: 3/29/2024 |
| Next Release Date: 4/30/2024 |