|
Download Data (XLS File) |
|
||||||||
|
||||||||
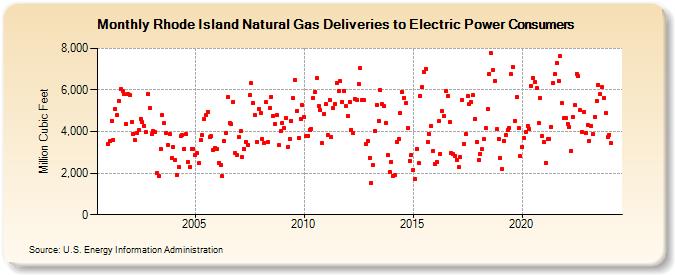
| Rhode Island Natural Gas Deliveries to Electric Power Consumers (Million Cubic Feet) | ||||||||
| Year | Jan | Feb | Mar | Apr | May | Jun | Jul | Aug | Sep | Oct | Nov | Dec |
|---|---|---|---|---|---|---|---|---|---|---|---|---|
| 2001 | 3,422 | 3,534 | 4,521 | 3,613 | 5,102 | 4,790 | 5,482 | 6,056 | 5,945 | 5,793 | 4,362 | 5,797 |
| 2002 | 5,753 | 4,458 | 3,904 | 3,575 | 3,920 | 4,095 | 4,617 | 4,444 | 4,282 | 3,985 | 5,812 | 5,121 |
| 2003 | 3,879 | 4,020 | 4,001 | 1,997 | 1,848 | 3,167 | 4,808 | 4,397 | 3,931 | 3,356 | 3,882 | 2,724 |
| 2004 | 3,264 | 2,652 | 1,896 | 2,316 | 3,763 | 3,842 | 3,174 | 3,864 | 2,516 | 2,312 | 3,179 | 3,181 |
| 2005 | 2,862 | 2,953 | 2,483 | 3,586 | 3,821 | 4,611 | 4,807 | 4,964 | 3,729 | 3,765 | 3,101 | 3,231 |
| 2006 | 3,153 | 2,496 | 2,376 | 1,840 | 3,537 | 3,934 | 5,664 | 4,426 | 4,347 | 5,415 | 2,975 | 2,871 |
| 2007 | 3,726 | 4,014 | 2,752 | 3,177 | 3,514 | 3,376 | 5,743 | 6,326 | 5,379 | 4,792 | 3,504 | 5,093 |
| 2008 | 4,888 | 3,652 | 3,459 | 5,405 | 3,502 | 5,135 | 5,684 | 4,745 | 4,365 | 4,804 | 3,337 | 4,006 |
| 2009 | 4,419 | 4,166 | 4,659 | 3,281 | 3,655 | 4,531 | 5,601 | 6,503 | 5,007 | 3,688 | 4,607 | 5,260 |
| 2010 | 4,706 | 3,765 | 3,802 | 4,089 | 4,146 | 5,607 | 5,900 | 6,563 | 5,217 | 5,020 | 3,448 | 4,858 |
| 2011 | 5,324 | 3,844 | 5,536 | 3,745 | 5,132 | 5,326 | 6,340 | 5,969 | 6,415 | 5,425 | 5,935 | 5,207 |
| 2012 | 4,731 | 5,438 | 4,098 | 3,941 | 5,581 | 5,535 | 6,267 | 7,039 | 5,516 | 5,498 | 3,384 | 3,524 |
| 2013 | 2,751 | 1,542 | 2,371 | 4,022 | 5,293 | 4,518 | 5,987 | 5,306 | 5,220 | 4,423 | 2,864 | 2,065 |
| 2014 | 2,542 | 1,842 | 1,919 | 3,516 | 3,650 | 4,891 | 5,893 | 5,632 | 5,360 | 4,151 | 2,595 | 2,877 |
| 2015 | 2,156 | 1,702 | 3,170 | 2,478 | 5,728 | 6,127 | 6,879 | 7,028 | 3,515 | 3,860 | 4,282 | 3,079 |
| 2016 | 2,438 | 2,528 | 4,488 | 2,924 | 4,988 | 4,743 | 5,947 | 5,705 | 4,459 | 2,955 | 2,904 | 2,828 |
| 2017 | 2,633 | 2,286 | 2,781 | 5,531 | 3,412 | 3,861 | 5,701 | 5,328 | 5,426 | 5,740 | 4,614 | 3,506 |
| 2018 | 2,614 | 2,909 | 3,143 | 3,640 | 4,170 | 5,077 | 6,792 | 7,761 | 6,937 | 6,448 | 4,109 | 3,661 |
| 2019 | 2,723 | 2,201 | 3,555 | 3,850 | 4,065 | 4,173 | 6,754 | 7,093 | 4,530 | 5,639 | 4,162 | 2,806 |
| 2020 | 3,257 | 3,666 | 3,986 | 4,268 | 4,134 | 6,214 | 6,588 | 6,377 | 6,091 | 4,419 | 5,615 | 3,805 |
| 2021 | 3,485 | 2,507 | 3,628 | 3,642 | 4,238 | 6,314 | 6,746 | 7,303 | 6,439 | 7,624 | 5,361 | 4,632 |
| 2022 | 4,639 | 4,380 | 4,216 | 3,088 | 4,720 | 5,259 | 6,783 | 6,650 | 5,035 | 3,984 | 4,946 | 3,936 |
| 2023 | 4,339 | 3,554 | 4,290 | 3,864 | 4,716 | 5,486 | 6,251 | 5,802 | 6,124 | 5,613 | 4,894 | 3,717 |
| 2024 | 3,853 | 3,442 | ||||||||||
| - = No Data Reported; -- = Not Applicable; NA = Not Available; W = Withheld to avoid disclosure of individual company data. |
| Release Date: 4/30/2024 |
| Next Release Date: 5/31/2024 |