|
Download Data (XLS File) |
|
||||||||
|
||||||||
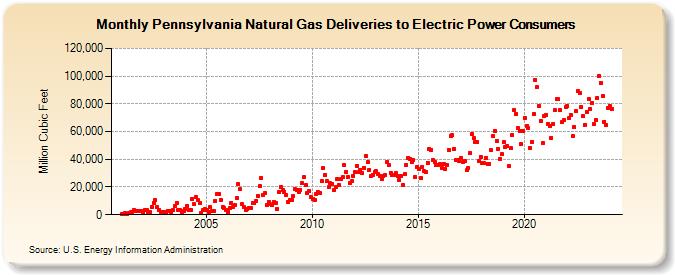
| Pennsylvania Natural Gas Deliveries to Electric Power Consumers (Million Cubic Feet) | ||||||||
| Year | Jan | Feb | Mar | Apr | May | Jun | Jul | Aug | Sep | Oct | Nov | Dec |
|---|---|---|---|---|---|---|---|---|---|---|---|---|
| 2001 | 486 | 712 | 1,140 | 773 | 1,109 | 1,771 | 2,262 | 3,427 | 2,964 | 2,732 | 2,582 | 2,675 |
| 2002 | 1,487 | 3,362 | 3,212 | 1,733 | 2,051 | 5,822 | 8,680 | 10,396 | 5,545 | 3,617 | 2,284 | 2,064 |
| 2003 | 1,872 | 1,635 | 2,717 | 2,468 | 2,210 | 3,279 | 6,446 | 8,721 | 3,401 | 3,391 | 2,248 | 2,849 |
| 2004 | 4,087 | 6,499 | 3,712 | 3,302 | 11,504 | 7,421 | 12,436 | 10,361 | 8,535 | 1,074 | 3,120 | 4,135 |
| 2005 | 3,681 | 2,103 | 5,459 | 2,436 | 2,771 | 10,076 | 14,795 | 14,914 | 10,640 | 5,409 | 4,766 | 3,590 |
| 2006 | 2,157 | 4,828 | 8,760 | 5,619 | 6,787 | 11,967 | 21,984 | 18,355 | 7,400 | 5,763 | 3,145 | 4,180 |
| 2007 | 4,526 | 4,801 | 8,321 | 8,736 | 10,083 | 13,836 | 20,615 | 26,512 | 14,429 | 15,466 | 7,305 | 9,323 |
| 2008 | 7,454 | 7,280 | 9,175 | 8,174 | 3,982 | 16,213 | 20,259 | 17,786 | 16,533 | 14,253 | 9,532 | 10,371 |
| 2009 | 10,419 | 13,431 | 18,228 | 17,654 | 16,339 | 18,146 | 22,675 | 27,006 | 21,129 | 15,828 | 17,045 | 12,643 |
| 2010 | 11,208 | 10,777 | 15,250 | 16,335 | 15,731 | 24,215 | 34,048 | 28,780 | 24,101 | 19,980 | 22,643 | 22,491 |
| 2011 | 18,005 | 19,710 | 25,719 | 21,288 | 25,785 | 26,921 | 35,804 | 30,637 | 27,055 | 22,797 | 24,307 | 28,239 |
| 2012 | 30,854 | 35,221 | 30,811 | 32,457 | 30,222 | 33,904 | 42,507 | 37,929 | 32,377 | 27,688 | 28,895 | 30,909 |
| 2013 | 31,265 | 29,226 | 27,755 | 25,860 | 27,653 | 28,672 | 38,195 | 35,879 | 30,294 | 28,772 | 28,583 | 30,198 |
| 2014 | 28,065 | 24,912 | 28,277 | 21,770 | 29,362 | 35,815 | 41,086 | 40,206 | 37,837 | 39,288 | 27,301 | 34,137 |
| 2015 | 32,952 | 26,471 | 34,602 | 31,493 | 31,152 | 37,533 | 47,447 | 47,012 | 39,530 | 37,886 | 36,127 | 35,771 |
| 2016 | 36,590 | 33,779 | 36,829 | 32,992 | 35,525 | 46,717 | 56,797 | 57,182 | 47,232 | 39,539 | 39,356 | 38,578 |
| 2017 | 40,926 | 37,976 | 38,531 | 32,014 | 33,817 | 44,546 | 57,900 | 54,996 | 52,112 | 52,720 | 39,113 | 41,869 |
| 2018 | 37,650 | 37,278 | 41,243 | 36,904 | 36,867 | 46,422 | 56,927 | 60,399 | 53,313 | 47,756 | 40,291 | 43,478 |
| 2019 | 52,305 | 49,011 | 49,607 | 34,832 | 47,853 | 57,337 | 75,263 | 72,530 | 62,586 | 60,065 | 50,744 | 60,375 |
| 2020 | 70,131 | 64,268 | 62,427 | 48,487 | 52,712 | 72,954 | 97,285 | 92,111 | 78,356 | 67,873 | 51,524 | 70,914 |
| 2021 | 72,209 | 65,377 | 64,146 | 55,534 | 65,213 | 75,257 | 83,370 | 83,162 | 75,530 | 66,599 | 68,327 | 77,520 |
| 2022 | 79,315 | 69,659 | 71,869 | 57,160 | 63,115 | 74,921 | 89,515 | 88,133 | 78,071 | 71,843 | 65,724 | 74,904 |
| 2023 | 82,833 | 75,850 | 80,256 | 65,698 | 68,267 | 84,369 | 99,906 | 96,299 | 85,782 | 68,312 | 65,164 | 76,864 |
| 2024 | 78,425 | 75,587 | 79,053 | 66,614 | 79,189 | 95,817 | 110,186 | 101,526 | 83,494 | 68,373 | 74,852 | 83,049 |
| 2025 | 90,100 | 80,725 | 74,459 | 67,996 | 82,345 | 94,884 | 109,339 | 95,274 | 83,227 | 70,335 | 65,978 | 84,428 |
| 2026 | 89,078 | 79,693 | 81,144 | |||||||||
| - = No Data Reported; -- = Not Applicable; NA = Not Available; W = Withheld to avoid disclosure of individual company data. |
| Release Date: 5/29/2026 |
| Next Release Date: 6/30/2026 |