|
Download Data (XLS File) |
|
||||||||
|
||||||||
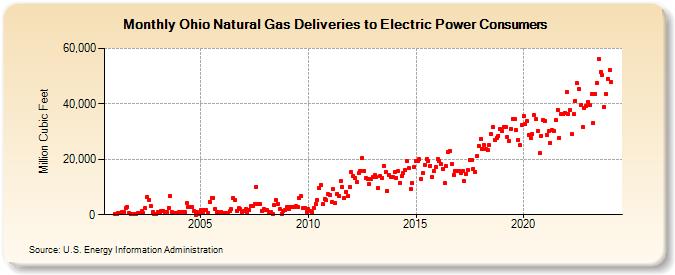
| Ohio Natural Gas Deliveries to Electric Power Consumers (Million Cubic Feet) | ||||||||
| Year | Jan | Feb | Mar | Apr | May | Jun | Jul | Aug | Sep | Oct | Nov | Dec |
|---|---|---|---|---|---|---|---|---|---|---|---|---|
| 2001 | 281 | 271 | 571 | 602 | 1,060 | 923 | 2,372 | 2,889 | 627 | 354 | 404 | 191 |
| 2002 | 184 | 740 | 645 | 1,261 | 655 | 2,444 | 6,411 | 5,335 | 3,175 | 1,034 | 410 | 428 |
| 2003 | 928 | 730 | 1,377 | 1,393 | 887 | 1,052 | 2,489 | 6,891 | 954 | 608 | 751 | 713 |
| 2004 | 822 | 888 | 881 | 809 | 4,107 | 2,668 | 2,843 | 2,634 | 1,400 | 68 | 862 | 276 |
| 2005 | 1,665 | 606 | 1,524 | 1,614 | 743 | 4,721 | 6,150 | 6,032 | 2,104 | 952 | 677 | 1,151 |
| 2006 | 563 | 500 | 564 | 503 | 1,213 | 1,904 | 6,113 | 5,191 | 1,347 | 2,246 | 1,958 | 1,081 |
| 2007 | 1,513 | 1,977 | 904 | 1,690 | 3,052 | 3,115 | 3,799 | 10,108 | 3,876 | 3,785 | 1,357 | 2,118 |
| 2008 | 1,697 | 1,683 | 1,100 | 838 | 149 | 3,605 | 5,228 | 4,037 | 1,892 | 293 | 1,182 | 1,789 |
| 2009 | 2,843 | 2,210 | 2,801 | 2,621 | 2,619 | 3,120 | 2,931 | 6,085 | 6,573 | 2,363 | 2,449 | 1,052 |
| 2010 | 2,020 | 1,234 | 1,047 | 2,345 | 3,725 | 5,438 | 9,546 | 10,740 | 3,766 | 5,657 | 5,176 | 7,467 |
| 2011 | 7,012 | 4,744 | 9,156 | 4,154 | 7,569 | 6,830 | 12,094 | 10,073 | 6,001 | 8,347 | 6,794 | 10,072 |
| 2012 | 15,282 | 13,986 | 13,403 | 11,636 | 14,972 | 15,950 | 20,479 | 15,870 | 13,233 | 12,767 | 11,033 | 12,980 |
| 2013 | 13,650 | 14,271 | 13,502 | 9,579 | 13,864 | 13,380 | 17,687 | 15,342 | 8,590 | 14,171 | 13,709 | 13,430 |
| 2014 | 15,401 | 13,408 | 15,733 | 11,354 | 13,816 | 15,108 | 16,219 | 19,286 | 16,891 | 9,195 | 11,471 | 17,339 |
| 2015 | 19,214 | 19,404 | 19,926 | 13,053 | 14,983 | 18,045 | 20,036 | 19,302 | 17,698 | 13,674 | 15,766 | 17,120 |
| 2016 | 19,989 | 19,433 | 18,262 | 16,532 | 11,314 | 17,446 | 22,526 | 22,905 | 18,196 | 14,351 | 15,769 | 15,804 |
| 2017 | 15,943 | 15,066 | 15,735 | 11,982 | 14,845 | 16,191 | 19,907 | 19,560 | 16,594 | 15,517 | 21,253 | 24,868 |
| 2018 | 27,291 | 23,791 | 25,061 | 23,560 | 23,222 | 25,148 | 29,115 | 31,534 | 27,066 | 27,755 | 28,504 | 30,879 |
| 2019 | 30,221 | 31,748 | 31,789 | 28,062 | 26,662 | 31,098 | 34,661 | 34,658 | 30,523 | 27,024 | 25,045 | 32,472 |
| 2020 | 35,659 | 32,633 | 33,757 | 28,906 | 27,529 | 29,053 | 35,799 | 34,419 | 30,324 | 22,118 | 28,513 | 34,289 |
| 2021 | 33,832 | 28,928 | 30,093 | 25,921 | 30,549 | 30,197 | 34,156 | 37,954 | 27,797 | 36,280 | 36,163 | 36,871 |
| 2022 | 44,167 | 36,354 | 37,814 | 28,997 | 36,212 | 41,136 | 47,377 | 45,348 | 39,730 | 31,473 | 38,358 | 39,387 |
| 2023 | 40,628 | 39,445 | 43,454 | 32,934 | 43,670 | 47,680 | 56,280 | 51,536 | 50,381 | 38,926 | 43,648 | 49,073 |
| 2024 | 52,179 | |||||||||||
| - = No Data Reported; -- = Not Applicable; NA = Not Available; W = Withheld to avoid disclosure of individual company data. |
| Release Date: 3/29/2024 |
| Next Release Date: 4/30/2024 |