|
Download Data (XLS File) |
|
||||||||
|
||||||||
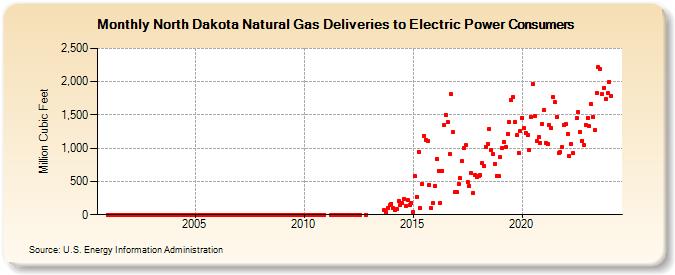
| North Dakota Natural Gas Deliveries to Electric Power Consumers (Million Cubic Feet) | ||||||||
| Year | Jan | Feb | Mar | Apr | May | Jun | Jul | Aug | Sep | Oct | Nov | Dec |
|---|---|---|---|---|---|---|---|---|---|---|---|---|
| 2001 | 0 | 0 | 0 | 0 | 1 | 0 | 0 | 0 | 0 | 0 | 0 | 0 |
| 2002 | 0 | 0 | 0 | 0 | 0 | 0 | 0 | 0 | 0 | 0 | 0 | 0 |
| 2003 | 0 | 0 | 0 | 0 | 0 | 0 | 0 | 0 | 0 | 0 | 0 | 0 |
| 2004 | 0 | 0 | 0 | 0 | 0 | 0 | 0 | 0 | 0 | 0 | 0 | 1 |
| 2005 | 0 | 0 | 0 | 0 | 0 | 0 | 0 | 0 | 0 | 0 | 0 | 0 |
| 2006 | 0 | 0 | 0 | 0 | 0 | 0 | 0 | 0 | 0 | 0 | 0 | 0 |
| 2007 | 1 | 0 | 0 | 0 | 0 | 0 | 0 | 0 | 0 | 0 | 0 | 0 |
| 2008 | 0 | 0 | 0 | 0 | 0 | 0 | 0 | 0 | 0 | 0 | 0 | 0 |
| 2009 | 0 | 0 | 1 | 0 | 0 | 0 | 0 | 0 | 0 | 0 | 0 | 0 |
| 2010 | 0 | 0 | 0 | 0 | 0 | 0 | 0 | 0 | 0 | 0 | 0 | 0 |
| 2011 | -- | -- | -- | 0 | 0 | 0 | 0 | 0 | 0 | 0 | -- | 0 |
| 2012 | 0 | -- | 0 | -- | 0 | 0 | 0 | 0 | -- | -- | 0 | -- |
| 2013 | -- | -- | -- | -- | -- | -- | -- | -- | 66 | 34 | 95 | 142 |
| 2014 | 166 | 103 | 72 | 87 | 207 | 150 | 175 | 242 | 138 | 227 | 145 | 175 |
| 2015 | 38 | 576 | 270 | 948 | 98 | 458 | 1,187 | 1,129 | 1,113 | 451 | 102 | 174 |
| 2016 | 435 | 840 | 664 | 178 | 662 | 1,347 | 1,506 | 1,397 | 909 | 1,809 | 1,237 | 336 |
| 2017 | 336 | 460 | 545 | 801 | 1,008 | 1,041 | 490 | 435 | 623 | 330 | 591 | 563 |
| 2018 | 586 | 592 | 777 | 731 | 1,021 | 1,060 | 1,291 | 977 | 910 | 765 | 587 | 576 |
| 2019 | 867 | 1,007 | 1,097 | 1,018 | 1,214 | 1,393 | 1,724 | 1,770 | 1,401 | 1,192 | 935 | 1,258 |
| 2020 | 1,459 | 1,303 | 1,235 | 1,192 | 967 | 1,474 | 1,962 | 1,481 | 1,108 | 1,164 | 1,079 | 1,370 |
| 2021 | 1,575 | 1,083 | 1,065 | 1,350 | 1,306 | 1,766 | 1,687 | 1,468 | 931 | 946 | 1,016 | 1,344 |
| 2022 | 1,364 | 1,217 | 876 | 1,062 | 922 | W | 1,455 | 1,541 | 1,246 | 1,113 | 1,049 | 1,355 |
| 2023 | 1,455 | 1,332 | 1,666 | 1,469 | 1,267 | 1,830 | 2,218 | 2,185 | 1,807 | 1,909 | 1,736 | 1,822 |
| 2024 | 2,000 | |||||||||||
| - = No Data Reported; -- = Not Applicable; NA = Not Available; W = Withheld to avoid disclosure of individual company data. |
| Release Date: 3/29/2024 |
| Next Release Date: 4/30/2024 |