|
Download Data (XLS File) |
|
||||||||
|
||||||||
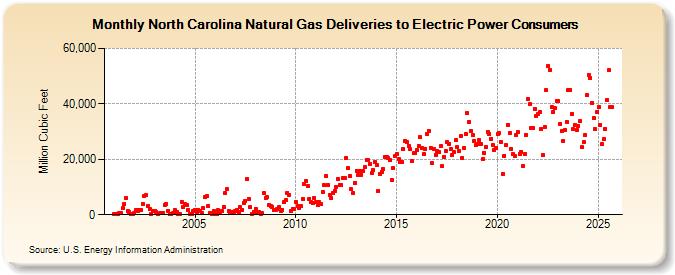
| North Carolina Natural Gas Deliveries to Electric Power Consumers (Million Cubic Feet) | ||||||||
| Year | Jan | Feb | Mar | Apr | May | Jun | Jul | Aug | Sep | Oct | Nov | Dec |
|---|---|---|---|---|---|---|---|---|---|---|---|---|
| 2001 | 200 | 103 | 199 | 461 | 577 | 2,266 | 3,764 | 6,039 | 1,231 | 1,016 | 189 | 201 |
| 2002 | 736 | 1,598 | 1,481 | 1,792 | 1,565 | 3,958 | 6,801 | 6,995 | 3,243 | 1,979 | 413 | 1,315 |
| 2003 | 1,488 | 915 | 334 | 512 | 517 | 539 | 3,656 | 3,813 | 1,465 | 211 | 268 | 632 |
| 2004 | 1,675 | 892 | 115 | 263 | 4,594 | 2,876 | 3,827 | 3,531 | 1,738 | 412 | 312 | 1,187 |
| 2005 | 1,827 | 485 | 1,841 | 1,404 | 748 | 2,362 | 6,332 | 6,613 | 3,067 | 770 | 239 | 1,320 |
| 2006 | 280 | 300 | 1,641 | 1,062 | 1,514 | 2,788 | 7,728 | 9,210 | 1,201 | 924 | 852 | 873 |
| 2007 | 1,193 | 1,568 | 862 | 2,678 | 1,745 | 4,270 | 5,005 | 12,968 | 5,681 | 2,759 | 398 | 1,027 |
| 2008 | 2,171 | 755 | 1,144 | 181 | 578 | 7,788 | 6,080 | 6,242 | 3,568 | 3,040 | 2,877 | 1,540 |
| 2009 | 1,798 | 1,912 | 2,674 | 1,314 | 1,761 | 4,481 | 5,303 | 7,937 | 7,103 | 1,259 | 2,241 | 2,133 |
| 2010 | 4,595 | 3,096 | 2,555 | 3,098 | 5,787 | 10,952 | 12,003 | 10,299 | 5,803 | 4,621 | 4,250 | 6,013 |
| 2011 | 4,681 | 3,473 | 4,445 | 3,691 | 8,148 | 10,582 | 14,049 | 10,826 | 7,157 | 6,183 | 7,969 | 8,594 |
| 2012 | 10,096 | 12,898 | 10,717 | 10,778 | 13,077 | 13,291 | 20,603 | 16,794 | 14,032 | 9,107 | 7,885 | 11,589 |
| 2013 | 15,937 | 14,435 | 15,941 | 14,360 | 15,756 | 17,294 | 19,699 | 19,566 | 18,418 | 15,030 | 16,111 | 18,942 |
| 2014 | 17,808 | 8,679 | 14,737 | 15,341 | 16,523 | 20,914 | 20,999 | 20,536 | 19,600 | 12,550 | 16,897 | 21,159 |
| 2015 | 21,918 | 20,049 | 19,126 | 19,169 | 23,790 | 26,615 | 26,073 | 24,915 | 23,600 | 19,405 | 22,253 | 22,441 |
| 2016 | 23,262 | 24,788 | 28,073 | 24,029 | 21,849 | 23,830 | 29,125 | 30,193 | 24,168 | 18,534 | 23,750 | 21,671 |
| 2017 | 23,056 | 22,680 | 24,688 | 17,458 | 20,911 | 22,821 | 26,126 | 25,674 | 23,776 | 21,626 | 22,625 | 26,801 |
| 2018 | 24,328 | 23,145 | 28,303 | 20,485 | 23,995 | 29,061 | 36,621 | 33,503 | 30,175 | 28,721 | 26,748 | 25,036 |
| 2019 | 25,607 | 26,791 | 25,466 | 19,976 | 22,371 | 24,502 | 29,924 | 29,220 | 27,442 | 25,086 | 23,354 | 23,954 |
| 2020 | 29,124 | 29,362 | 26,143 | 14,793 | 21,294 | 25,042 | 32,472 | 29,532 | 23,857 | 21,833 | 21,320 | 28,589 |
| 2021 | 29,804 | 21,966 | 22,804 | 17,432 | 21,791 | 28,794 | 41,810 | 39,825 | 31,295 | 31,283 | 38,287 | 35,713 |
| 2022 | 35,815 | 36,990 | 30,636 | 20,996 | 31,827 | 44,403 | 52,898 | 51,325 | 37,958 | 37,034 | 38,212 | 40,643 |
| 2023 | 40,970 | 32,693 | 30,188 | 26,679 | 30,651 | 33,618 | 44,875 | 45,082 | 36,337 | 30,787 | 32,307 | 30,684 |
| 2024 | 34,914 | 34,415 | 25,651 | 27,376 | 30,217 | 44,444 | ||||||
| - = No Data Reported; -- = Not Applicable; NA = Not Available; W = Withheld to avoid disclosure of individual company data. |
| Release Date: 8/30/2024 |
| Next Release Date: 9/30/2024 |