|
Download Data (XLS File) |
|
||||||||
|
||||||||
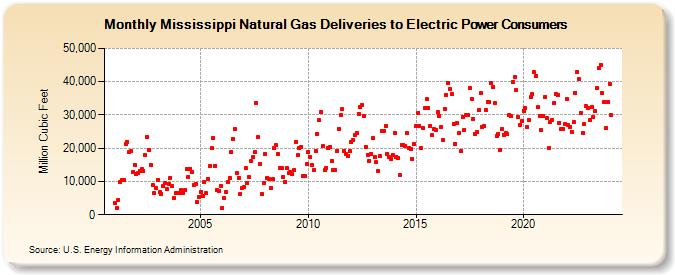
| Mississippi Natural Gas Deliveries to Electric Power Consumers (Million Cubic Feet) | ||||||||
| Year | Jan | Feb | Mar | Apr | May | Jun | Jul | Aug | Sep | Oct | Nov | Dec |
|---|---|---|---|---|---|---|---|---|---|---|---|---|
| 2001 | 3,552 | 1,877 | 4,445 | 9,786 | 10,365 | 10,566 | 21,171 | 21,933 | 18,783 | 19,065 | 12,944 | 14,943 |
| 2002 | 12,280 | 12,553 | 13,002 | 13,836 | 13,207 | 17,814 | 23,291 | 19,402 | 15,022 | 8,932 | 6,416 | 7,909 |
| 2003 | 10,537 | 6,713 | 6,275 | 8,585 | 9,406 | 7,621 | 9,146 | 11,168 | 8,487 | 5,103 | 6,419 | 6,622 |
| 2004 | 6,495 | 7,503 | 6,484 | 7,475 | 13,877 | 11,437 | 13,889 | 12,823 | 9,052 | 9,339 | 3,729 | 5,330 |
| 2005 | 6,900 | 5,736 | 9,790 | 6,431 | 10,822 | 14,589 | 20,048 | 23,145 | 14,759 | 7,375 | 7,251 | 8,717 |
| 2006 | 2,121 | 5,018 | 6,901 | 9,740 | 10,981 | 18,748 | 22,703 | 25,830 | 12,444 | 11,142 | 6,299 | 7,992 |
| 2007 | 8,200 | 13,957 | 9,507 | 11,262 | 16,057 | 17,216 | 18,805 | 33,558 | 23,269 | 15,313 | 6,355 | 9,497 |
| 2008 | 18,214 | 11,146 | 10,727 | 8,158 | 10,652 | 19,952 | 20,850 | 18,381 | 14,002 | 13,968 | 11,427 | 9,868 |
| 2009 | 13,928 | 12,439 | 12,960 | 12,098 | 13,417 | 21,971 | 17,882 | 19,925 | 20,392 | 11,524 | 11,527 | 15,282 |
| 2010 | 18,894 | 17,303 | 14,904 | 13,440 | 19,090 | 24,203 | 28,351 | 31,018 | 20,549 | 13,309 | 14,085 | 20,103 |
| 2011 | 20,448 | 16,289 | 13,306 | 13,418 | 19,137 | 25,710 | 29,847 | 31,641 | 19,259 | 18,204 | 17,740 | 19,051 |
| 2012 | 21,831 | 22,451 | 24,096 | 24,548 | 30,403 | 32,327 | 33,007 | 29,713 | 20,428 | 18,099 | 16,114 | 18,324 |
| 2013 | 22,938 | 17,430 | 15,709 | 13,193 | 17,573 | 25,055 | 25,246 | 26,727 | 18,381 | 17,335 | 16,777 | 17,909 |
| 2014 | 24,566 | 17,490 | 17,164 | 11,924 | 20,926 | 21,040 | 20,673 | 24,474 | 20,174 | 19,833 | 16,870 | 21,399 |
| 2015 | 26,571 | 30,586 | 26,789 | 20,019 | 26,176 | 32,118 | 34,689 | 32,028 | 26,709 | 23,829 | 25,669 | 25,534 |
| 2016 | 30,858 | 29,753 | 26,478 | 22,463 | 31,812 | 36,028 | 39,499 | 37,750 | 36,271 | 27,237 | 21,348 | 27,542 |
| 2017 | 24,646 | 19,136 | 29,436 | 25,534 | 29,864 | 29,832 | 38,129 | 34,809 | 28,768 | 24,374 | 25,003 | 31,330 |
| 2018 | 36,461 | 26,359 | 26,620 | 31,457 | 34,006 | 33,962 | 39,516 | 38,441 | 33,632 | 23,618 | 24,243 | 19,540 |
| 2019 | 25,800 | 24,078 | 24,500 | 24,231 | 30,033 | 29,635 | 39,948 | 41,277 | 37,362 | 29,233 | 27,032 | 28,057 |
| 2020 | 31,328 | 31,939 | 26,340 | 28,358 | 35,379 | 36,334 | 42,753 | 41,639 | 32,277 | 29,778 | 25,330 | 29,741 |
| 2021 | 35,387 | 28,963 | 19,973 | 27,997 | 28,593 | 33,557 | 36,236 | 35,839 | 27,584 | 25,680 | 25,840 | 27,146 |
| 2022 | 34,839 | 26,870 | 26,380 | 25,006 | 27,811 | 36,719 | 43,045 | 40,720 | 30,693 | 24,471 | 27,254 | 32,567 |
| 2023 | 32,211 | 28,431 | 32,243 | 29,299 | 31,119 | 38,053 | 43,971 | 45,108 | 36,537 | 33,947 | 26,165 | 33,919 |
| 2024 | 39,445 | |||||||||||
| - = No Data Reported; -- = Not Applicable; NA = Not Available; W = Withheld to avoid disclosure of individual company data. |
| Release Date: 3/29/2024 |
| Next Release Date: 4/30/2024 |