|
Download Data (XLS File) |
|
||||||||
|
||||||||
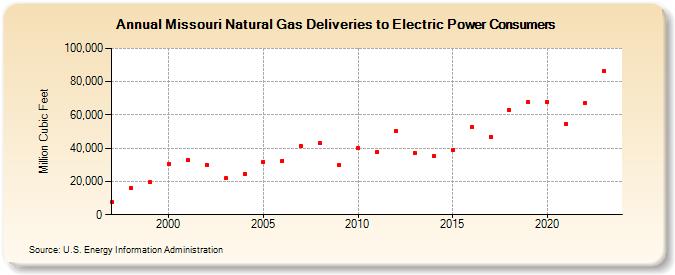
| Missouri Natural Gas Deliveries to Electric Power Consumers (Million Cubic Feet) | ||||||||
| Decade | Year-0 | Year-1 | Year-2 | Year-3 | Year-4 | Year-5 | Year-6 | Year-7 | Year-8 | Year-9 |
|---|---|---|---|---|---|---|---|---|---|---|
| 1990's | 7,465 | 16,034 | 19,428 | |||||||
| 2000's | 30,481 | 32,805 | 29,911 | 21,778 | 24,574 | 31,831 | 32,480 | 41,067 | 43,009 | 29,807 |
| 2010's | 40,216 | 37,626 | 50,538 | 37,119 | 35,127 | 38,633 | 52,480 | 46,972 | 62,977 | 67,538 |
| 2020's | 68,061 | 54,640 | 67,379 | 86,436 |
| - = No Data Reported; -- = Not Applicable; NA = Not Available; W = Withheld to avoid disclosure of individual company data. |
| Release Date: 3/29/2024 |
| Next Release Date: 4/30/2024 |