|
Download Data (XLS File) |
|
||||||||
|
||||||||
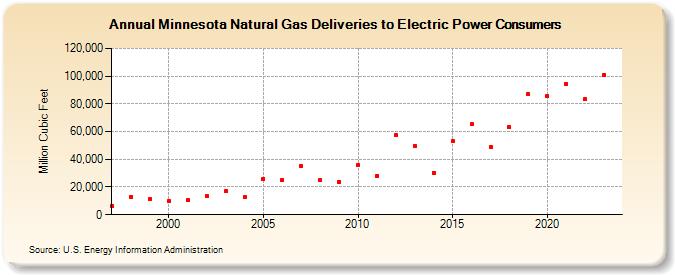
| Minnesota Natural Gas Deliveries to Electric Power Consumers (Million Cubic Feet) | ||||||||
| Decade | Year-0 | Year-1 | Year-2 | Year-3 | Year-4 | Year-5 | Year-6 | Year-7 | Year-8 | Year-9 |
|---|---|---|---|---|---|---|---|---|---|---|
| 1990's | 6,117 | 12,974 | 11,334 | |||||||
| 2000's | 9,895 | 10,610 | 13,181 | 16,752 | 12,773 | 26,024 | 24,911 | 34,790 | 24,900 | 23,665 |
| 2010's | 36,076 | 28,244 | 57,190 | 49,640 | 30,437 | 53,096 | 65,227 | 49,052 | 63,110 | 86,744 |
| 2020's | 85,500 | 94,441 | 83,188 | 100,949 |
| - = No Data Reported; -- = Not Applicable; NA = Not Available; W = Withheld to avoid disclosure of individual company data. |
| Release Date: 8/30/2024 |
| Next Release Date: 9/30/2024 |