|
Download Data (XLS File) |
|
||||||||
|
||||||||
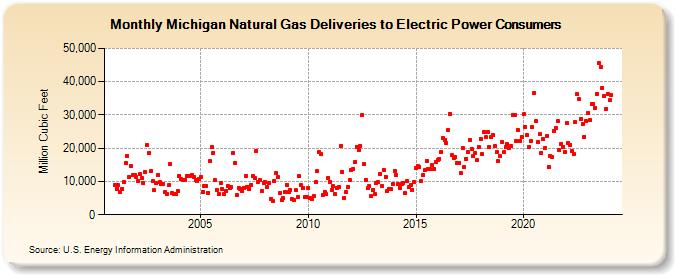
| Michigan Natural Gas Deliveries to Electric Power Consumers (Million Cubic Feet) | ||||||||
| Year | Jan | Feb | Mar | Apr | May | Jun | Jul | Aug | Sep | Oct | Nov | Dec |
|---|---|---|---|---|---|---|---|---|---|---|---|---|
| 2001 | 9,024 | 7,813 | 8,850 | 6,900 | 7,748 | 9,902 | 15,513 | 17,622 | 11,276 | 14,520 | 11,915 | 11,972 |
| 2002 | 11,301 | 10,280 | 12,090 | 10,941 | 9,599 | 12,844 | 20,819 | 18,463 | 13,037 | 10,028 | 7,328 | 9,403 |
| 2003 | 11,993 | 9,809 | 9,212 | 9,259 | 6,786 | 6,352 | 8,797 | 15,273 | 6,415 | 6,138 | 6,210 | 7,076 |
| 2004 | 11,717 | 10,675 | 10,456 | 10,451 | 11,704 | 11,622 | 11,757 | 11,929 | 11,422 | 10,471 | 10,238 | 10,743 |
| 2005 | 11,433 | 6,832 | 8,692 | 8,677 | 6,476 | 16,004 | 20,326 | 18,634 | 10,323 | 7,428 | 6,371 | 9,405 |
| 2006 | 7,680 | 6,183 | 7,271 | 8,695 | 8,049 | 8,207 | 18,626 | 15,553 | 5,950 | 8,099 | 7,856 | 7,060 |
| 2007 | 8,140 | 11,772 | 8,380 | 7,741 | 8,922 | 11,612 | 10,999 | 19,216 | 9,947 | 10,287 | 7,034 | 9,591 |
| 2008 | 9,826 | 8,246 | 9,426 | 4,869 | 4,157 | 10,278 | 12,490 | 11,249 | 6,482 | 4,553 | 4,986 | 6,891 |
| 2009 | 9,043 | 6,913 | 7,354 | 4,676 | 4,297 | 7,312 | 5,289 | 11,537 | 8,834 | 8,049 | 5,304 | 5,197 |
| 2010 | 8,086 | 5,005 | 4,846 | 5,517 | 9,736 | 13,077 | 18,851 | 18,151 | 6,074 | 6,876 | 6,101 | 10,925 |
| 2011 | 9,935 | 7,487 | 8,483 | 6,102 | 8,127 | 8,434 | 20,538 | 12,985 | 5,169 | 6,708 | 8,473 | 10,343 |
| 2012 | 13,361 | 13,826 | 15,940 | 20,448 | 19,353 | 20,794 | 29,884 | 15,198 | 10,524 | 7,910 | 8,494 | 5,504 |
| 2013 | 7,409 | 6,203 | 9,594 | 9,825 | 12,236 | 8,747 | 13,556 | 11,423 | 7,264 | 7,699 | 7,580 | 9,160 |
| 2014 | 13,150 | 11,885 | 9,232 | 8,060 | 9,188 | 9,446 | 6,490 | 10,028 | 8,196 | 8,810 | 7,442 | 9,891 |
| 2015 | 13,951 | 14,499 | 14,332 | 10,037 | 11,924 | 13,328 | 16,264 | 13,677 | 13,612 | 14,827 | 13,848 | 15,903 |
| 2016 | 16,416 | 16,849 | 18,925 | 22,958 | 22,513 | 21,471 | 25,486 | 30,330 | 17,814 | 17,156 | 17,274 | 15,595 |
| 2017 | 15,584 | 12,520 | 20,126 | 14,206 | 16,840 | 18,713 | 22,549 | 19,875 | 17,625 | 18,701 | 16,325 | 20,398 |
| 2018 | 22,730 | 18,304 | 24,925 | 23,219 | 24,888 | 20,289 | 23,241 | 23,924 | 20,553 | 18,716 | 16,020 | 17,529 |
| 2019 | 21,874 | 18,715 | 20,294 | 21,120 | 20,091 | 20,711 | 30,117 | 29,898 | 22,203 | 25,418 | 22,215 | 23,428 |
| 2020 | 30,178 | 26,490 | 23,826 | 20,393 | 22,018 | 26,320 | 36,547 | 28,025 | 21,886 | 24,164 | 18,412 | 22,655 |
| 2021 | 20,019 | 23,676 | 14,300 | 17,615 | 17,303 | 25,025 | 26,085 | 28,101 | 19,369 | 21,354 | 20,345 | 18,861 |
| 2022 | 27,436 | 21,555 | 20,981 | 19,053 | 18,112 | 27,770 | 36,199 | 34,664 | 28,738 | 27,260 | 23,471 | 28,124 |
| 2023 | 30,573 | 28,424 | 33,331 | 33,136 | 32,172 | 36,231 | 45,595 | 44,430 | 38,197 | 35,701 | 31,810 | 36,268 |
| 2024 | 34,398 | |||||||||||
| - = No Data Reported; -- = Not Applicable; NA = Not Available; W = Withheld to avoid disclosure of individual company data. |
| Release Date: 3/29/2024 |
| Next Release Date: 4/30/2024 |