|
Download Data (XLS File) |
|
||||||||
|
||||||||
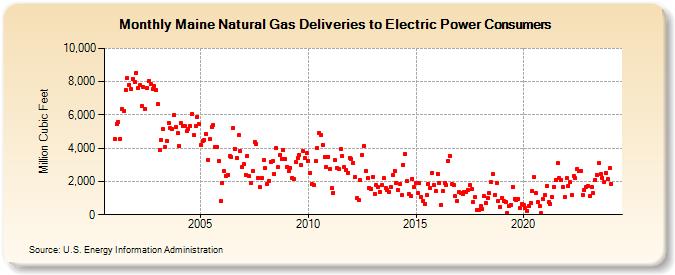
| Maine Natural Gas Deliveries to Electric Power Consumers (Million Cubic Feet) | ||||||||
| Year | Jan | Feb | Mar | Apr | May | Jun | Jul | Aug | Sep | Oct | Nov | Dec |
|---|---|---|---|---|---|---|---|---|---|---|---|---|
| 2001 | 4,548 | 5,484 | 5,575 | 4,579 | 6,364 | 6,254 | 7,517 | 8,230 | 7,828 | 7,534 | 8,167 | 7,964 |
| 2002 | 8,535 | 7,612 | 7,776 | 6,539 | 7,668 | 6,350 | 7,614 | 8,041 | 7,831 | 7,554 | 7,749 | 7,498 |
| 2003 | 6,649 | 3,865 | 4,509 | 5,130 | 4,088 | 4,441 | 5,529 | 5,184 | 5,144 | 5,992 | 5,250 | 4,885 |
| 2004 | 4,143 | 5,500 | 5,324 | 5,309 | 5,016 | 5,125 | 5,323 | 6,042 | 4,778 | 5,328 | 5,893 | 5,464 |
| 2005 | 4,191 | 4,461 | 4,518 | 4,825 | 3,300 | 4,540 | 5,261 | 5,371 | 4,092 | 4,046 | 3,205 | 836 |
| 2006 | 1,923 | 2,622 | 2,355 | 2,405 | 3,514 | 3,478 | 5,218 | 3,965 | 3,424 | 4,769 | 3,826 | 2,843 |
| 2007 | 3,033 | 2,383 | 3,553 | 2,327 | 1,912 | 2,651 | 4,376 | 4,252 | 2,232 | 1,656 | 2,229 | 3,268 |
| 2008 | 2,795 | 1,818 | 2,022 | 3,171 | 3,215 | 2,452 | 4,011 | 2,845 | 3,617 | 3,379 | 3,912 | 3,358 |
| 2009 | 2,888 | 2,604 | 2,831 | 2,225 | 2,128 | 3,162 | 3,385 | 3,596 | 2,996 | 3,827 | 3,405 | 3,697 |
| 2010 | 3,244 | 2,511 | 1,825 | 1,767 | 3,224 | 4,001 | 4,930 | 4,817 | 4,216 | 3,493 | 2,875 | 3,489 |
| 2011 | 2,752 | 1,615 | 1,331 | 3,280 | 2,830 | 2,743 | 3,957 | 3,532 | 2,871 | 2,676 | 2,535 | 3,432 |
| 2012 | 3,364 | 3,125 | 2,272 | 989 | 879 | 2,067 | 3,611 | 4,143 | 2,646 | 2,205 | 1,624 | 1,532 |
| 2013 | 2,284 | 1,274 | 1,783 | 1,658 | 1,385 | 1,777 | 2,183 | 1,629 | 1,485 | 1,385 | 1,678 | 2,383 |
| 2014 | 2,644 | 1,910 | 1,489 | 1,818 | 1,161 | 3,014 | 3,650 | 1,999 | 1,235 | 1,138 | 2,150 | 1,641 |
| 2015 | 1,888 | 1,308 | 1,884 | 1,051 | 827 | 674 | 1,176 | 1,856 | 1,591 | 2,524 | 1,815 | 1,439 |
| 2016 | 2,451 | 1,897 | 606 | 1,408 | 1,917 | 1,765 | 3,241 | 3,554 | 1,829 | 1,766 | 1,119 | 813 |
| 2017 | 1,337 | 1,280 | 1,252 | 1,387 | 1,390 | 1,491 | 1,769 | 1,527 | 739 | 1,041 | 260 | 287 |
| 2018 | 498 | 356 | 1,096 | 715 | 1,002 | 1,280 | 1,980 | 2,419 | 1,187 | 1,898 | 841 | 474 |
| 2019 | 1,034 | 837 | 740 | 130 | 516 | 605 | 1,686 | 965 | 857 | 961 | 385 | 643 |
| 2020 | 601 | 396 | 226 | 515 | 730 | 1,428 | 2,260 | 1,305 | 745 | 545 | 85 | 918 |
| 2021 | 1,183 | 1,727 | 736 | 656 | 1,078 | 1,692 | 2,103 | 3,105 | 2,218 | 2,059 | 1,688 | 1,063 |
| 2022 | 2,196 | 1,744 | 1,941 | 1,211 | 2,357 | 2,196 | 2,774 | 2,652 | 2,621 | 1,204 | 1,476 | 1,669 |
| 2023 | 1,734 | 1,112 | 1,665 | 1,281 | 2,117 | 2,397 | 3,110 | 2,426 | 2,216 | 1,966 | 2,519 | 2,131 |
| 2024 | 2,788 | 1,850 | ||||||||||
| - = No Data Reported; -- = Not Applicable; NA = Not Available; W = Withheld to avoid disclosure of individual company data. |
| Release Date: 4/30/2024 |
| Next Release Date: 5/31/2024 |