|
Download Data (XLS File) |
|
||||||||
|
||||||||
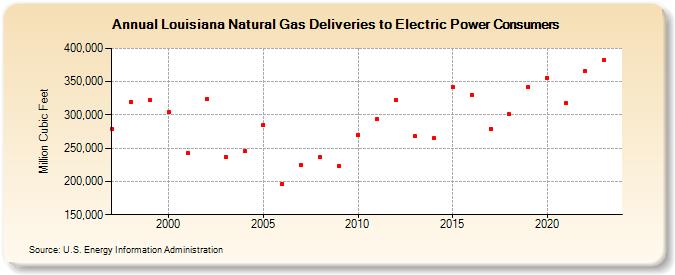
| Louisiana Natural Gas Deliveries to Electric Power Consumers (Million Cubic Feet) | ||||||||
| Decade | Year-0 | Year-1 | Year-2 | Year-3 | Year-4 | Year-5 | Year-6 | Year-7 | Year-8 | Year-9 |
|---|---|---|---|---|---|---|---|---|---|---|
| 1990's | 279,258 | 320,034 | 322,360 | |||||||
| 2000's | 304,791 | 243,017 | 323,804 | 236,408 | 245,361 | 285,022 | 195,927 | 224,419 | 236,543 | 222,486 |
| 2010's | 270,528 | 293,245 | 322,632 | 267,629 | 264,668 | 342,506 | 330,541 | 279,290 | 300,919 | 341,847 |
| 2020's | 355,914 | 317,255 | 365,456 | 382,352 |
| - = No Data Reported; -- = Not Applicable; NA = Not Available; W = Withheld to avoid disclosure of individual company data. |
| Release Date: 8/30/2024 |
| Next Release Date: 9/30/2024 |