|
Download Data (XLS File) |
|
||||||||
|
||||||||
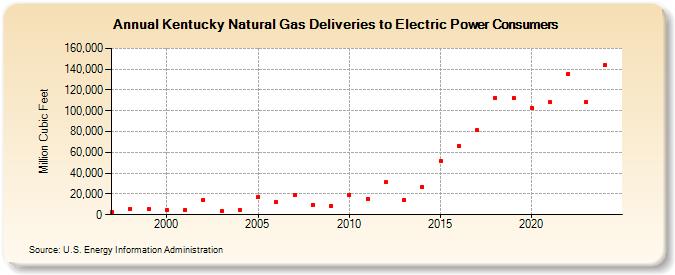
| Kentucky Natural Gas Deliveries to Electric Power Consumers (Million Cubic Feet) | ||||||||
| Decade | Year-0 | Year-1 | Year-2 | Year-3 | Year-4 | Year-5 | Year-6 | Year-7 | Year-8 | Year-9 |
|---|---|---|---|---|---|---|---|---|---|---|
| 1990's | 2,194 | 5,782 | 5,686 | |||||||
| 2000's | 4,202 | 4,433 | 13,712 | 3,667 | 4,833 | 17,181 | 12,287 | 19,376 | 9,584 | 8,399 |
| 2010's | 19,284 | 15,575 | 31,194 | 14,536 | 26,793 | 51,723 | 66,359 | 81,208 | 112,656 | 112,369 |
| 2020's | 102,809 | 107,977 | 137,415 | 108,294 |
| - = No Data Reported; -- = Not Applicable; NA = Not Available; W = Withheld to avoid disclosure of individual company data. |
| Release Date: 3/29/2024 |
| Next Release Date: 4/30/2024 |