|
Download Data (XLS File) |
|
||||||||
|
||||||||
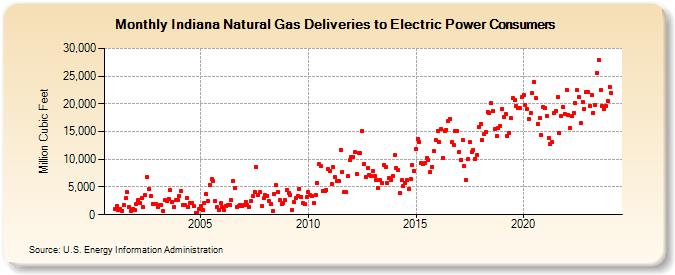
| Indiana Natural Gas Deliveries to Electric Power Consumers (Million Cubic Feet) | ||||||||
| Year | Jan | Feb | Mar | Apr | May | Jun | Jul | Aug | Sep | Oct | Nov | Dec |
|---|---|---|---|---|---|---|---|---|---|---|---|---|
| 2001 | 1,009 | 1,490 | 772 | 1,087 | 753 | 1,818 | 2,926 | 4,027 | 1,339 | 600 | 1,088 | 869 |
| 2002 | 1,860 | 2,683 | 2,173 | 3,043 | 1,326 | 3,544 | 6,744 | 4,557 | 3,299 | 1,903 | 2,010 | 1,962 |
| 2003 | 1,395 | 1,700 | 1,800 | 603 | 2,583 | 2,402 | 2,865 | 4,399 | 2,334 | 1,387 | 2,628 | 2,576 |
| 2004 | 3,287 | 4,188 | 1,799 | 1,693 | 3,079 | 1,320 | 2,176 | 2,179 | 1,520 | 393 | 332 | 980 |
| 2005 | 1,534 | 844 | 2,175 | 3,653 | 2,422 | 5,416 | 6,420 | 6,106 | 2,540 | 1,339 | 862 | 2,064 |
| 2006 | 1,376 | 779 | 1,617 | 1,685 | 1,740 | 2,619 | 6,100 | 4,873 | 1,454 | 1,584 | 1,831 | 1,554 |
| 2007 | 1,708 | 2,361 | 1,761 | 1,386 | 2,416 | 3,316 | 4,183 | 8,519 | 3,620 | 4,033 | 1,625 | 2,944 |
| 2008 | 3,468 | 3,422 | 2,486 | 1,870 | 594 | 3,743 | 5,352 | 4,162 | 2,645 | 1,874 | 2,106 | 2,589 |
| 2009 | 4,517 | 3,958 | 3,562 | 850 | 2,254 | 3,011 | 3,367 | 4,725 | 3,258 | 2,047 | 1,865 | 3,163 |
| 2010 | 4,068 | 3,514 | 3,299 | 2,097 | 3,576 | 5,682 | 9,089 | 8,741 | 4,265 | 4,232 | 4,490 | 8,190 |
| 2011 | 7,936 | 5,599 | 8,557 | 6,764 | 6,060 | 6,028 | 11,743 | 7,696 | 4,016 | 4,127 | 6,926 | 9,848 |
| 2012 | 10,451 | 10,389 | 11,310 | 7,267 | 11,154 | 11,057 | 15,119 | 9,148 | 6,872 | 8,357 | 7,243 | 6,959 |
| 2013 | 7,851 | 6,951 | 6,303 | 4,734 | 6,198 | 5,644 | 9,046 | 8,663 | 5,789 | 6,560 | 6,266 | 7,008 |
| 2014 | 10,707 | 8,477 | 8,008 | 3,991 | 6,189 | 5,188 | 5,666 | 6,195 | 4,604 | 6,445 | 8,969 | 7,923 |
| 2015 | 11,783 | 13,696 | 13,117 | 9,311 | 9,208 | 9,337 | 10,272 | 9,932 | 7,777 | 8,621 | 11,416 | 13,496 |
| 2016 | 15,082 | 13,185 | 15,464 | 10,314 | 15,092 | 15,362 | 16,937 | 17,277 | 13,083 | 12,625 | 15,085 | 15,180 |
| 2017 | 11,378 | 9,936 | 13,501 | 8,767 | 6,326 | 9,991 | 13,027 | 11,341 | 11,635 | 10,124 | 10,803 | 15,855 |
| 2018 | 16,437 | 13,439 | 14,510 | 14,905 | 18,545 | 18,351 | 20,088 | 18,788 | 15,436 | 14,238 | 15,562 | 15,919 |
| 2019 | 19,038 | 17,580 | 18,093 | 14,228 | 14,750 | 17,415 | 21,068 | 20,753 | 19,600 | 19,162 | 19,212 | 21,185 |
| 2020 | 21,558 | 19,703 | 18,998 | 17,217 | 18,370 | 21,937 | 24,016 | 20,982 | 16,410 | 17,468 | 14,359 | 19,431 |
| 2021 | 19,211 | 17,830 | 13,852 | 12,805 | 13,049 | 18,341 | 18,682 | 21,217 | 14,666 | 17,743 | 19,469 | 18,214 |
| 2022 | 22,509 | 18,034 | 15,677 | 17,732 | 18,317 | 20,086 | 22,417 | 21,149 | 16,526 | 20,363 | 19,130 | 22,050 |
| 2023 | 22,103 | 19,632 | 21,565 | 18,416 | 19,867 | 25,557 | 27,844 | 22,466 | 19,600 | 19,154 | 19,585 | 20,558 |
| 2024 | 23,122 | |||||||||||
| - = No Data Reported; -- = Not Applicable; NA = Not Available; W = Withheld to avoid disclosure of individual company data. |
| Release Date: 3/29/2024 |
| Next Release Date: 4/30/2024 |