|
Download Data (XLS File) |
|
||||||||
|
||||||||
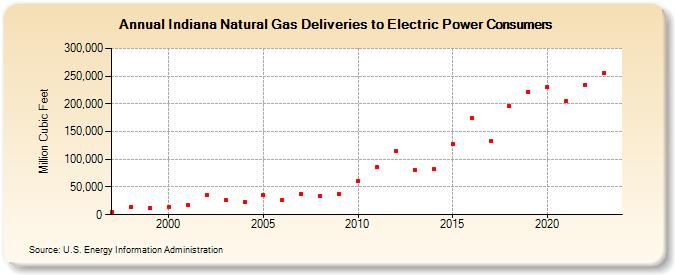
| Indiana Natural Gas Deliveries to Electric Power Consumers (Million Cubic Feet) | ||||||||
| Decade | Year-0 | Year-1 | Year-2 | Year-3 | Year-4 | Year-5 | Year-6 | Year-7 | Year-8 | Year-9 |
|---|---|---|---|---|---|---|---|---|---|---|
| 1990's | 4,661 | 13,678 | 12,515 | |||||||
| 2000's | 14,513 | 17,777 | 35,104 | 26,672 | 22,946 | 35,376 | 27,213 | 37,871 | 34,312 | 36,576 |
| 2010's | 61,242 | 85,298 | 115,328 | 81,013 | 82,361 | 127,964 | 174,685 | 132,684 | 196,219 | 222,085 |
| 2020's | 230,450 | 205,077 | 233,990 | 256,346 |
| - = No Data Reported; -- = Not Applicable; NA = Not Available; W = Withheld to avoid disclosure of individual company data. |
| Release Date: 4/30/2024 |
| Next Release Date: 5/31/2024 |