|
Download Data (XLS File) |
|
||||||||
|
||||||||
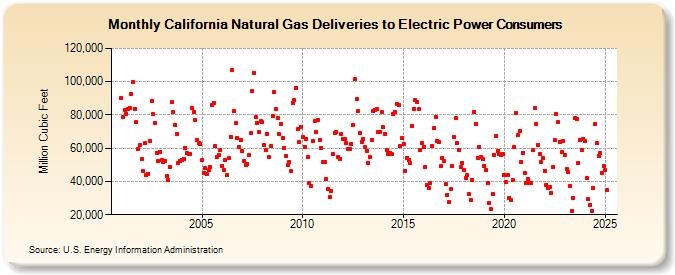
| California Natural Gas Deliveries to Electric Power Consumers (Million Cubic Feet) | ||||||||
| Year | Jan | Feb | Mar | Apr | May | Jun | Jul | Aug | Sep | Oct | Nov | Dec |
|---|---|---|---|---|---|---|---|---|---|---|---|---|
| 2001 | 90,070 | 78,688 | 82,936 | 80,724 | 83,703 | 84,253 | 92,713 | 100,006 | 83,677 | 75,445 | 59,350 | 61,761 |
| 2002 | 53,569 | 46,030 | 62,953 | 44,074 | 44,768 | 64,112 | 88,478 | 80,441 | 75,298 | 57,204 | 52,006 | 57,695 |
| 2003 | 52,963 | 51,480 | 52,364 | 43,190 | 40,837 | 48,698 | 87,492 | 81,851 | 74,232 | 68,666 | 51,327 | 52,244 |
| 2004 | 52,770 | 53,789 | 60,295 | 56,992 | 56,398 | 56,402 | 84,330 | 81,551 | 77,112 | 65,163 | 63,338 | 62,377 |
| 2005 | 52,729 | 45,266 | 47,897 | 44,239 | 46,818 | 48,797 | 86,224 | 86,927 | 61,079 | 54,455 | 55,973 | 58,767 |
| 2006 | 49,457 | 46,922 | 53,099 | 44,123 | 54,019 | 66,829 | 107,131 | 82,273 | 74,886 | 66,357 | 60,771 | 64,967 |
| 2007 | 58,108 | 52,341 | 49,608 | 50,513 | 55,663 | 68,902 | 94,286 | 105,148 | 78,588 | 75,091 | 69,766 | 76,274 |
| 2008 | 75,456 | 61,884 | 58,876 | 68,653 | 54,824 | 61,085 | 79,247 | 93,649 | 83,545 | 77,850 | 68,314 | 74,486 |
| 2009 | 66,135 | 59,822 | 55,355 | 49,661 | 51,598 | 46,107 | 87,393 | 89,115 | 96,366 | 71,255 | 63,515 | 72,606 |
| 2010 | 66,583 | 60,737 | 65,509 | 54,721 | 39,236 | 37,085 | 64,051 | 76,275 | 69,752 | 76,902 | 64,944 | 60,297 |
| 2011 | 51,610 | 51,394 | 41,357 | 35,375 | 30,546 | 34,436 | 56,668 | 69,261 | 69,651 | 54,481 | 53,508 | 68,276 |
| 2012 | 65,556 | 65,299 | 63,258 | 59,439 | 59,554 | 62,632 | 73,812 | 101,388 | 89,558 | 82,060 | 68,922 | 63,863 |
| 2013 | 65,611 | 60,460 | 58,410 | 50,993 | 54,820 | 64,713 | 82,592 | 83,179 | 83,420 | 69,869 | 69,803 | 81,844 |
| 2014 | 72,448 | 68,285 | 58,980 | 56,546 | 57,046 | 56,205 | 80,285 | 82,009 | 86,626 | 85,776 | 61,219 | 66,095 |
| 2015 | 62,816 | 46,537 | 54,168 | 52,671 | 50,951 | 73,309 | 83,645 | 88,850 | 87,498 | 83,347 | 59,144 | 62,996 |
| 2016 | 60,932 | 48,599 | 38,154 | 36,115 | 39,062 | 61,452 | 71,837 | 78,970 | 64,331 | 63,461 | 48,998 | 54,108 |
| 2017 | 52,415 | 38,222 | 31,728 | 27,579 | 35,197 | 49,186 | 67,003 | 77,936 | 62,939 | 58,968 | 48,472 | 51,344 |
| 2018 | 46,910 | 41,978 | 43,596 | 32,377 | 28,895 | 41,128 | 81,991 | 74,280 | 54,342 | 60,861 | 54,987 | 53,379 |
| 2019 | 49,576 | 46,738 | 39,015 | 26,879 | 23,217 | 32,720 | 55,908 | 67,181 | 58,171 | 56,499 | 56,113 | 56,325 |
| 2020 | 44,002 | 39,471 | 43,888 | 30,233 | 28,749 | 41,123 | 60,779 | 81,134 | 67,755 | 70,033 | 51,814 | 57,272 |
| 2021 | 45,260 | 39,320 | 41,649 | 39,063 | 39,330 | 58,693 | 84,015 | 74,623 | 62,127 | 56,664 | 51,454 | 53,883 |
| 2022 | 45,838 | 37,608 | 35,419 | 36,975 | 32,962 | 48,126 | 64,917 | 80,333 | 75,320 | 63,847 | 57,609 | 63,792 |
| 2023 | 55,897 | 47,442 | 45,744 | 37,231 | 22,332 | 30,119 | 78,082 | 77,742 | 51,286 | 65,147 | 58,840 | 65,397 |
| 2024 | 65,021 | |||||||||||
| - = No Data Reported; -- = Not Applicable; NA = Not Available; W = Withheld to avoid disclosure of individual company data. |
| Release Date: 3/29/2024 |
| Next Release Date: 4/30/2024 |