|
Download Data (XLS File) |
|
||||||||
|
||||||||
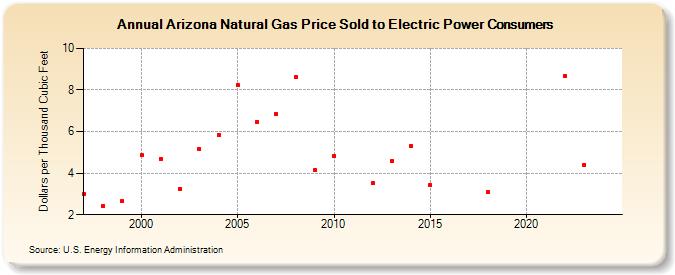
| Arizona Natural Gas Price Sold to Electric Power Consumers (Dollars per Thousand Cubic Feet) | ||||||||
| Decade | Year-0 | Year-1 | Year-2 | Year-3 | Year-4 | Year-5 | Year-6 | Year-7 | Year-8 | Year-9 |
|---|---|---|---|---|---|---|---|---|---|---|
| 1990's | 2.99 | 2.42 | 2.67 | |||||||
| 2000's | 4.86 | 4.70 | 3.26 | 5.16 | 5.84 | 8.24 | 6.48 | 6.84 | 8.60 | 4.16 |
| 2010's | 4.84 | W | 3.51 | 4.60 | 5.30 | 3.43 | W | W | 3.08 | W |
| 2020's | W | W | 8.68 | 4.35 |
| - = No Data Reported; -- = Not Applicable; NA = Not Available; W = Withheld to avoid disclosure of individual company data. |
| Release Date: 3/29/2024 |
| Next Release Date: 4/30/2024 |