|
Download Data (XLS File) |
|
||||||||
|
||||||||
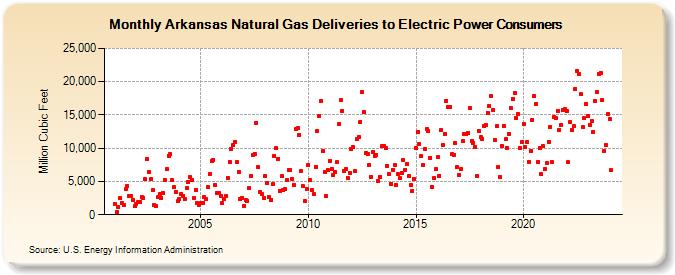
| Arkansas Natural Gas Deliveries to Electric Power Consumers (Million Cubic Feet) | ||||||||
| Year | Jan | Feb | Mar | Apr | May | Jun | Jul | Aug | Sep | Oct | Nov | Dec |
|---|---|---|---|---|---|---|---|---|---|---|---|---|
| 2001 | 1,668 | 392 | 1,164 | 2,511 | 1,753 | 1,403 | 3,790 | 4,318 | 2,798 | 2,845 | 2,200 | 1,253 |
| 2002 | 1,580 | 1,857 | 1,919 | 2,681 | 2,524 | 5,309 | 8,423 | 6,460 | 5,298 | 3,676 | 1,415 | 1,288 |
| 2003 | 2,616 | 3,165 | 2,530 | 3,278 | 5,252 | 6,844 | 8,883 | 9,093 | 5,199 | 4,109 | 3,382 | 2,018 |
| 2004 | 2,308 | 3,105 | 2,888 | 2,298 | 3,950 | 4,978 | 5,639 | 5,291 | 2,578 | 3,784 | 1,789 | 1,531 |
| 2005 | 1,819 | 1,725 | 2,640 | 2,356 | 4,185 | 6,114 | 8,057 | 8,276 | 4,441 | 3,327 | 3,215 | 2,832 |
| 2006 | 1,786 | 2,436 | 2,788 | 5,482 | 7,993 | 9,918 | 10,440 | 10,944 | 7,912 | 6,430 | 2,352 | 2,575 |
| 2007 | 1,369 | 2,229 | 2,131 | 3,953 | 5,874 | 8,942 | 9,144 | 13,834 | 7,106 | 3,448 | 3,063 | 2,501 |
| 2008 | 5,793 | 4,741 | 2,674 | 2,250 | 4,578 | 8,892 | 10,013 | 8,444 | 3,560 | 5,770 | 3,659 | 3,815 |
| 2009 | 5,211 | 6,752 | 6,750 | 5,398 | 4,515 | 12,852 | 13,003 | 12,008 | 6,626 | 4,256 | 2,007 | 3,889 |
| 2010 | 7,438 | 5,152 | 3,682 | 3,120 | 7,170 | 12,631 | 14,801 | 17,112 | 9,548 | 6,474 | 2,772 | 6,654 |
| 2011 | 8,137 | 6,894 | 5,991 | 6,417 | 7,876 | 13,665 | 17,199 | 15,614 | 6,548 | 6,832 | 5,511 | 6,329 |
| 2012 | 9,880 | 10,173 | 6,554 | 11,312 | 11,660 | 13,998 | 18,416 | 15,385 | 9,328 | 9,154 | 7,487 | 5,712 |
| 2013 | 9,364 | 8,799 | 9,038 | 5,061 | 5,737 | 10,275 | 10,385 | 9,958 | 7,386 | 6,069 | 4,686 | 6,795 |
| 2014 | 7,420 | 4,512 | 6,071 | 5,553 | 6,338 | 8,150 | 6,783 | 7,681 | 5,758 | 4,496 | 3,615 | 5,420 |
| 2015 | 9,981 | 12,428 | 10,639 | 8,840 | 7,400 | 9,908 | 12,815 | 12,556 | 8,588 | 4,135 | 5,446 | 6,818 |
| 2016 | 8,629 | 5,866 | 12,695 | 10,434 | 12,107 | 17,126 | 16,153 | 16,253 | 9,071 | 9,016 | 10,822 | 7,146 |
| 2017 | 6,022 | 6,862 | 11,042 | 12,188 | 12,067 | 12,326 | 16,036 | 11,088 | 10,771 | 10,164 | 5,858 | 12,625 |
| 2018 | 11,635 | 11,405 | 13,378 | 13,536 | 15,356 | 16,404 | 17,779 | 15,770 | 11,207 | 13,280 | 7,213 | 5,702 |
| 2019 | 10,302 | 13,344 | 11,326 | 10,046 | 12,115 | 15,969 | 17,430 | 18,330 | 14,529 | 15,138 | 10,094 | 10,909 |
| 2020 | 13,615 | 10,191 | 10,986 | 7,950 | 9,555 | 14,311 | 17,806 | 16,615 | 7,937 | 10,062 | 6,059 | 10,287 |
| 2021 | 6,942 | 7,699 | 10,955 | 13,147 | 7,915 | 14,689 | 14,470 | 15,645 | 12,804 | 13,511 | 15,784 | 15,837 |
| 2022 | 15,597 | 7,881 | 13,895 | 12,790 | 13,313 | 18,928 | 21,622 | 21,125 | 18,127 | 13,150 | 14,472 | 16,703 |
| 2023 | 14,797 | 13,511 | 14,016 | 12,443 | 17,091 | 18,514 | 21,123 | 21,366 | 17,307 | 9,553 | 10,473 | 15,114 |
| 2024 | 14,421 | |||||||||||
| - = No Data Reported; -- = Not Applicable; NA = Not Available; W = Withheld to avoid disclosure of individual company data. |
| Release Date: 3/29/2024 |
| Next Release Date: 4/30/2024 |