|
Download Data (XLS File) |
|
||||||||
|
||||||||
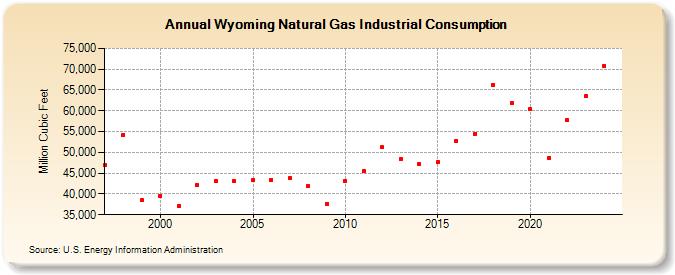
| Wyoming Natural Gas Industrial Consumption (Million Cubic Feet) | ||||||||
| Decade | Year-0 | Year-1 | Year-2 | Year-3 | Year-4 | Year-5 | Year-6 | Year-7 | Year-8 | Year-9 |
|---|---|---|---|---|---|---|---|---|---|---|
| 1990's | 46,936 | 54,259 | 38,475 | |||||||
| 2000's | 39,604 | 37,136 | 42,115 | 43,000 | 43,086 | 43,304 | 43,460 | 43,830 | 41,890 | 37,654 |
| 2010's | 43,059 | 45,462 | 51,190 | 48,387 | 47,153 | 47,667 | 52,810 | 54,512 | 66,272 | 61,755 |
| 2020's | 60,368 | 48,702 | 57,776 | NA |
| - = No Data Reported; -- = Not Applicable; NA = Not Available; W = Withheld to avoid disclosure of individual company data. |
| Release Date: 3/29/2024 |
| Next Release Date: 4/30/2024 |