|
Download Data (XLS File) |
|
||||||||
|
||||||||
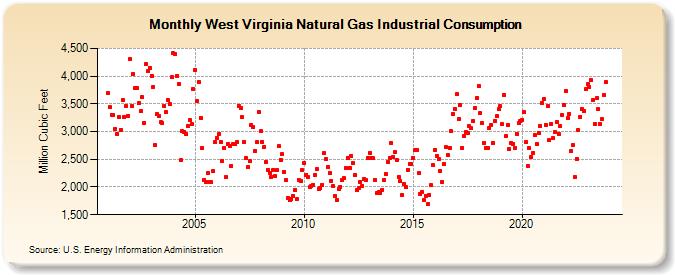
| West Virginia Natural Gas Industrial Consumption (Million Cubic Feet) | ||||||||
| Year | Jan | Feb | Mar | Apr | May | Jun | Jul | Aug | Sep | Oct | Nov | Dec |
|---|---|---|---|---|---|---|---|---|---|---|---|---|
| 2001 | 3,688 | 3,436 | 3,300 | 3,293 | 3,050 | 2,959 | 3,258 | 3,035 | 3,571 | 3,265 | 3,459 | 3,284 |
| 2002 | 4,308 | 3,461 | 4,035 | 3,787 | 3,783 | 3,512 | 3,369 | 3,619 | 3,160 | 4,218 | 4,094 | 4,147 |
| 2003 | 4,009 | 3,804 | 2,754 | 3,308 | 3,279 | 3,166 | 3,157 | 3,460 | 3,350 | 3,562 | 3,499 | 3,977 |
| 2004 | 4,412 | 4,390 | 4,009 | 3,856 | 2,481 | 3,002 | 2,997 | 2,949 | 3,105 | 3,206 | 3,131 | 3,770 |
| 2005 | 4,117 | 3,543 | 3,894 | 3,245 | 2,701 | 2,133 | 2,098 | 2,254 | 2,096 | 2,084 | 2,283 | 2,815 |
| 2006 | 2,887 | 2,955 | 2,812 | 2,462 | 2,706 | 2,178 | 2,781 | 2,742 | 2,383 | 2,784 | 2,770 | 2,814 |
| 2007 | 3,469 | 3,421 | 3,254 | 2,811 | 2,520 | 2,352 | 2,461 | 3,116 | 3,078 | 2,655 | 2,806 | 3,357 |
| 2008 | 3,004 | 2,810 | 2,725 | 2,457 | 2,314 | 2,247 | 2,187 | 2,312 | 2,196 | 2,300 | 2,731 | 2,494 |
| 2009 | 2,587 | 2,271 | 2,119 | 1,805 | 1,759 | 1,775 | 1,843 | 1,952 | 1,776 | 2,132 | 2,107 | 2,305 |
| 2010 | 2,434 | 2,222 | 2,183 | 1,995 | 2,013 | 2,042 | 2,216 | 2,324 | 1,961 | 1,980 | 2,041 | 2,611 |
| 2011 | 2,502 | 2,364 | 2,248 | 2,112 | 2,020 | 1,844 | 1,769 | 1,960 | 2,003 | 2,122 | 2,154 | 2,347 |
| 2012 | 2,529 | 2,343 | 2,559 | 2,433 | 2,217 | 1,950 | 1,976 | 2,098 | 2,023 | 2,148 | 2,129 | 2,522 |
| 2013 | 2,616 | 2,526 | 2,517 | 2,123 | 1,890 | 1,913 | 1,900 | 1,951 | 2,125 | 2,233 | 2,459 | 2,528 |
| 2014 | 2,793 | 2,548 | 2,625 | 2,486 | 2,181 | 2,105 | 1,860 | 2,062 | 1,991 | 2,311 | 2,419 | 2,416 |
| 2015 | 2,529 | 2,669 | 2,672 | 2,245 | 1,874 | 1,916 | 1,757 | 1,846 | 1,688 | 1,861 | 2,027 | 2,390 |
| 2016 | 2,669 | 2,566 | 2,513 | 2,287 | 2,093 | 2,417 | 2,715 | 2,586 | 2,710 | 3,002 | 3,319 | 3,406 |
| 2017 | 3,672 | 3,224 | 3,484 | 2,705 | 2,920 | 2,997 | 2,980 | 3,092 | 3,059 | 3,192 | 3,432 | 3,601 |
| 2018 | 3,819 | 3,330 | 3,152 | 2,798 | 2,703 | 2,710 | 3,069 | 3,126 | 2,793 | 3,197 | 3,272 | 3,406 |
| 2019 | 3,452 | 3,129 | 3,663 | 2,912 | 3,120 | 2,686 | 2,801 | 2,783 | 2,708 | 2,958 | 3,161 | 3,197 |
| 2020 | 3,216 | 3,357 | 2,819 | 2,379 | 2,700 | 2,537 | 2,620 | 2,933 | 2,782 | 2,982 | 3,107 | 3,518 |
| 2021 | 3,586 | 3,124 | 3,457 | 2,843 | 3,136 | 2,876 | 2,991 | 3,171 | 2,958 | 3,096 | 3,299 | 3,470 |
| 2022 | 3,734 | 3,237 | 3,323 | 2,650 | 2,750 | 2,182 | 2,502 | 3,022 | 3,269 | 3,406 | 3,365 | 3,759 |
| 2023 | 3,856 | 3,803 | 3,926 | 3,567 | 3,138 | 3,599 | 3,399 | 3,141 | 3,220 | 3,658 | 3,897 | NA |
| 2024 | 4,564 | 4,114 | 4,034 | NA | 3,571 | 3,542 | ||||||
| - = No Data Reported; -- = Not Applicable; NA = Not Available; W = Withheld to avoid disclosure of individual company data. |
| Release Date: 8/30/2024 |
| Next Release Date: 9/30/2024 |