|
Download Data (XLS File) |
|
||||||||
|
||||||||
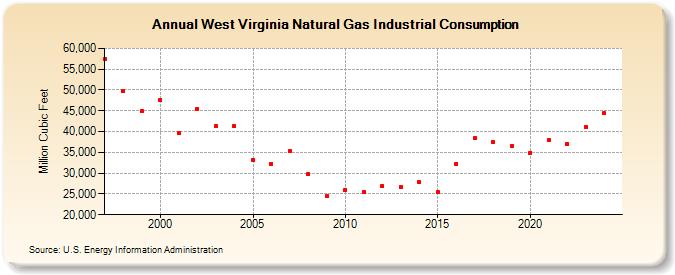
| West Virginia Natural Gas Industrial Consumption (Million Cubic Feet) | ||||||||
| Decade | Year-0 | Year-1 | Year-2 | Year-3 | Year-4 | Year-5 | Year-6 | Year-7 | Year-8 | Year-9 |
|---|---|---|---|---|---|---|---|---|---|---|
| 1990's | 57,380 | 49,807 | 44,857 | |||||||
| 2000's | 47,598 | 39,598 | 45,492 | 41,325 | 41,308 | 33,263 | 32,274 | 35,302 | 29,777 | 24,432 |
| 2010's | 26,023 | 25,443 | 26,926 | 26,780 | 27,796 | 25,474 | 32,281 | 38,358 | 37,374 | 36,570 |
| 2020's | 34,950 | 38,009 | 37,198 | NA |
| - = No Data Reported; -- = Not Applicable; NA = Not Available; W = Withheld to avoid disclosure of individual company data. |
| Release Date: 4/30/2024 |
| Next Release Date: 5/31/2024 |