|
Download Data (XLS File) |
|
||||||||
|
||||||||
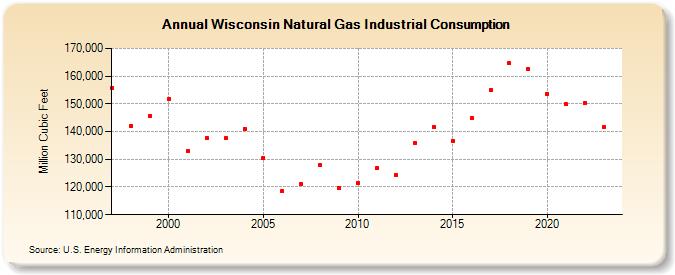
| Wisconsin Natural Gas Industrial Consumption (Million Cubic Feet) | ||||||||
| Decade | Year-0 | Year-1 | Year-2 | Year-3 | Year-4 | Year-5 | Year-6 | Year-7 | Year-8 | Year-9 |
|---|---|---|---|---|---|---|---|---|---|---|
| 1990's | 155,677 | 141,980 | 145,703 | |||||||
| 2000's | 151,923 | 132,982 | 137,706 | 137,605 | 141,084 | 130,570 | 118,396 | 121,111 | 127,818 | 119,711 |
| 2010's | 121,408 | 126,856 | 124,338 | 136,034 | 141,661 | 136,709 | 144,801 | 154,920 | 164,613 | 162,622 |
| 2020's | 153,714 | 149,841 | 150,232 | 141,647 |
| - = No Data Reported; -- = Not Applicable; NA = Not Available; W = Withheld to avoid disclosure of individual company data. |
| Release Date: 3/29/2024 |
| Next Release Date: 4/30/2024 |