|
Download Data (XLS File) |
|
||||||||
|
||||||||
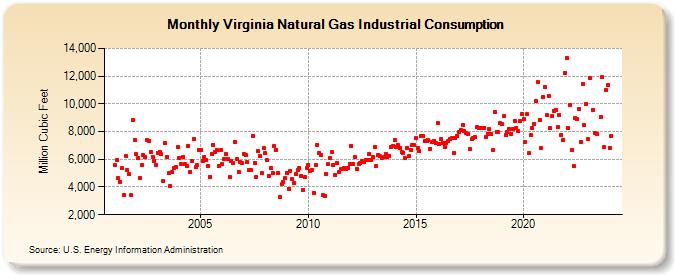
| Virginia Natural Gas Industrial Consumption (Million Cubic Feet) | ||||||||
| Year | Jan | Feb | Mar | Apr | May | Jun | Jul | Aug | Sep | Oct | Nov | Dec |
|---|---|---|---|---|---|---|---|---|---|---|---|---|
| 2001 | 5,554 | 5,924 | 4,623 | 4,388 | 5,348 | 3,437 | 6,230 | 5,204 | 4,911 | 3,420 | 8,820 | 7,375 |
| 2002 | 6,351 | 6,083 | 4,656 | 5,588 | 6,276 | 6,159 | 7,390 | 7,330 | 6,500 | 6,162 | 5,866 | 5,613 |
| 2003 | 6,484 | 6,550 | 6,373 | 4,408 | 7,190 | 6,196 | 4,980 | 4,068 | 5,070 | 5,399 | 5,457 | 6,916 |
| 2004 | 6,111 | 5,660 | 6,190 | 5,642 | 5,534 | 6,983 | 5,094 | 5,890 | 7,489 | 5,437 | 5,551 | 6,670 |
| 2005 | 6,697 | 5,856 | 6,173 | 5,965 | 5,488 | 4,756 | 6,408 | 7,055 | 6,543 | 6,643 | 5,498 | 6,659 |
| 2006 | 5,642 | 6,035 | 6,404 | 6,039 | 4,705 | 5,879 | 5,758 | 7,264 | 6,022 | 5,100 | 5,815 | 5,755 |
| 2007 | 6,375 | 6,277 | 5,839 | 5,237 | 5,195 | 7,701 | 5,761 | 4,756 | 6,578 | 6,250 | 4,987 | 6,780 |
| 2008 | 6,419 | 5,918 | 4,813 | 5,393 | 5,032 | 6,948 | 6,669 | 4,996 | 3,282 | 4,186 | 4,363 | 4,622 |
| 2009 | 5,039 | 3,841 | 5,189 | 4,575 | 4,274 | 4,928 | 5,238 | 5,355 | 4,806 | 3,819 | 4,698 | 5,381 |
| 2010 | 5,586 | 5,156 | 5,253 | 3,588 | 5,556 | 7,012 | 6,426 | 6,335 | 3,400 | 3,321 | 4,956 | 5,654 |
| 2011 | 6,121 | 6,498 | 5,613 | 4,845 | 5,717 | 5,054 | 5,276 | 5,328 | 5,390 | 5,272 | 5,359 | 5,674 |
| 2012 | 6,962 | 5,682 | 6,161 | 5,331 | 5,634 | 5,747 | 5,880 | 5,786 | 5,970 | 5,967 | 6,399 | 5,967 |
| 2013 | 6,181 | 6,901 | 5,486 | 6,336 | 6,257 | 6,097 | 6,140 | 6,380 | 6,145 | 6,213 | 6,886 | 6,975 |
| 2014 | 7,376 | 6,908 | 7,062 | 6,788 | 6,540 | 6,467 | 6,056 | 6,820 | 6,240 | 6,686 | 7,063 | 7,033 |
| 2015 | 7,550 | 6,805 | 6,605 | 7,711 | 7,646 | 7,320 | 7,286 | 7,360 | 6,752 | 7,260 | 7,338 | 7,186 |
| 2016 | 8,622 | 7,101 | 7,455 | 7,179 | 6,894 | 7,195 | 7,352 | 7,432 | 7,531 | 6,455 | 7,546 | 7,661 |
| 2017 | 7,937 | 8,080 | 8,471 | 8,036 | 7,899 | 7,849 | 6,707 | 7,443 | 7,556 | 7,585 | 8,299 | 8,235 |
| 2018 | 8,239 | 8,245 | 8,261 | 7,619 | 7,834 | 8,179 | 7,825 | 6,639 | 9,416 | 8,000 | 7,948 | 8,588 |
| 2019 | 8,544 | 9,113 | 7,755 | 7,976 | 8,154 | 7,842 | 8,205 | 8,748 | 8,286 | 8,014 | 8,735 | 9,236 |
| 2020 | 8,886 | 7,231 | 9,240 | 6,417 | 7,748 | 8,236 | 8,545 | 10,189 | 11,608 | 8,867 | 6,787 | 10,501 |
| 2021 | 11,219 | 9,179 | 10,597 | 8,253 | 9,125 | 9,509 | 9,577 | 8,336 | 9,193 | 7,760 | 7,400 | 12,225 |
| 2022 | 13,297 | 8,273 | 9,884 | 6,702 | 5,486 | 8,956 | 8,880 | 9,663 | 7,260 | 11,435 | 8,453 | 10,015 |
| 2023 | 7,431 | 11,870 | NA | 9,582 | 7,869 | 7,812 | NA | 9,055 | 11,916 | 6,882 | 11,031 | 11,366 |
| 2024 | 6,826 | 7,683 | ||||||||||
| - = No Data Reported; -- = Not Applicable; NA = Not Available; W = Withheld to avoid disclosure of individual company data. |
| Release Date: 4/30/2024 |
| Next Release Date: 5/31/2024 |