|
Download Data (XLS File) |
|
||||||||
|
||||||||
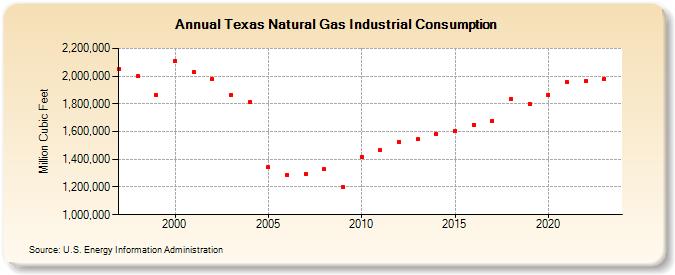
| Texas Natural Gas Industrial Consumption (Million Cubic Feet) | ||||||||
| Decade | Year-0 | Year-1 | Year-2 | Year-3 | Year-4 | Year-5 | Year-6 | Year-7 | Year-8 | Year-9 |
|---|---|---|---|---|---|---|---|---|---|---|
| 1990's | 2,049,290 | 1,998,932 | 1,864,830 | |||||||
| 2000's | 2,110,475 | 2,029,809 | 1,978,184 | 1,866,138 | 1,814,173 | 1,341,461 | 1,288,887 | 1,296,976 | 1,326,451 | 1,198,472 |
| 2010's | 1,418,780 | 1,464,681 | 1,526,812 | 1,544,083 | 1,585,742 | 1,606,000 | 1,649,759 | 1,678,504 | 1,838,402 | 1,799,319 |
| 2020's | 1,865,744 | 1,956,073 | 1,962,995 | 1,982,436 |
| - = No Data Reported; -- = Not Applicable; NA = Not Available; W = Withheld to avoid disclosure of individual company data. |
| Release Date: 3/29/2024 |
| Next Release Date: 4/30/2024 |