|
Download Data (XLS File) |
|
||||||||
|
||||||||
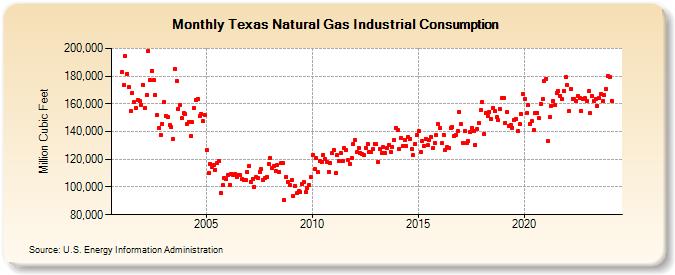
| Texas Natural Gas Industrial Consumption (Million Cubic Feet) | ||||||||
| Year | Jan | Feb | Mar | Apr | May | Jun | Jul | Aug | Sep | Oct | Nov | Dec |
|---|---|---|---|---|---|---|---|---|---|---|---|---|
| 2001 | 182,736 | 173,653 | 194,151 | 181,708 | 172,227 | 154,950 | 168,168 | 161,273 | 156,874 | 162,820 | 161,815 | 159,434 |
| 2002 | 173,921 | 157,028 | 166,204 | 198,261 | 176,856 | 183,885 | 177,469 | 166,495 | 152,084 | 142,717 | 137,598 | 145,667 |
| 2003 | 161,673 | 151,087 | 150,493 | 144,425 | 143,171 | 134,864 | 185,078 | 176,595 | 156,602 | 159,504 | 149,475 | 153,171 |
| 2004 | 152,480 | 145,621 | 147,078 | 136,484 | 146,577 | 156,942 | 162,747 | 163,394 | 150,968 | 152,693 | 147,395 | 151,795 |
| 2005 | 126,867 | 109,956 | 116,420 | 114,207 | 115,944 | 112,481 | 117,029 | 119,033 | 95,868 | 101,146 | 106,533 | 105,977 |
| 2006 | 108,827 | 101,638 | 109,588 | 108,376 | 109,687 | 106,883 | 108,921 | 108,776 | 105,473 | 105,198 | 104,814 | 110,706 |
| 2007 | 115,247 | 103,609 | 105,923 | 100,116 | 106,859 | 106,600 | 111,135 | 112,658 | 104,872 | 106,187 | 107,095 | 116,676 |
| 2008 | 121,159 | 113,773 | 115,023 | 111,726 | 115,979 | 110,838 | 117,442 | 117,641 | 90,657 | 107,225 | 103,814 | 101,174 |
| 2009 | 105,049 | 93,560 | 100,624 | 95,417 | 97,019 | 96,543 | 102,258 | 103,712 | 96,351 | 99,422 | 101,519 | 106,998 |
| 2010 | 123,242 | 113,046 | 121,033 | 110,756 | 118,553 | 118,150 | 123,284 | 119,976 | 118,060 | 111,063 | 117,300 | 124,317 |
| 2011 | 127,043 | 109,828 | 122,893 | 118,398 | 124,718 | 118,606 | 128,035 | 126,955 | 119,154 | 116,819 | 120,980 | 131,251 |
| 2012 | 133,728 | 125,122 | 128,477 | 124,613 | 123,935 | 122,822 | 128,267 | 131,072 | 124,971 | 125,359 | 127,111 | 131,336 |
| 2013 | 130,695 | 118,161 | 127,583 | 124,423 | 128,633 | 124,711 | 128,004 | 130,405 | 125,380 | 129,123 | 134,167 | 142,798 |
| 2014 | 140,888 | 127,448 | 135,561 | 129,422 | 133,904 | 129,458 | 135,899 | 134,723 | 127,100 | 122,863 | 131,090 | 137,385 |
| 2015 | 140,247 | 125,336 | 133,061 | 129,764 | 134,880 | 130,022 | 133,700 | 135,975 | 128,074 | 132,045 | 137,582 | 145,313 |
| 2016 | 142,240 | 131,520 | 137,784 | 126,871 | 128,630 | 128,351 | 142,462 | 143,182 | 136,898 | 137,229 | 140,148 | 154,444 |
| 2017 | 145,245 | 132,098 | 140,169 | 131,686 | 132,867 | 139,718 | 142,703 | 140,049 | 130,515 | 142,070 | 146,006 | 155,380 |
| 2018 | 161,055 | 138,219 | 153,610 | 151,073 | 154,422 | 149,036 | 157,290 | 154,658 | 150,376 | 148,106 | 156,425 | 164,134 |
| 2019 | 164,545 | 146,425 | 154,046 | 143,845 | 145,051 | 142,830 | 148,069 | 149,207 | 140,135 | 145,196 | 152,645 | 167,322 |
| 2020 | 163,577 | 153,438 | 158,884 | 145,624 | 147,428 | 141,044 | 153,055 | 153,600 | 149,727 | 159,976 | 163,179 | 176,212 |
| 2021 | 178,191 | 132,988 | 150,331 | 158,615 | 162,278 | 158,888 | 168,108 | 169,214 | 165,542 | 163,143 | 169,491 | 179,283 |
| 2022 | 173,563 | 154,704 | 170,922 | 163,742 | 163,683 | 162,047 | 165,915 | 164,532 | 154,745 | 163,306 | 163,860 | 161,975 |
| 2023 | 169,209 | 153,092 | 165,691 | 162,393 | 163,401 | 158,632 | 163,845 | 167,010 | 161,759 | 166,680 | 170,734 | 179,990 |
| 2024 | 179,698 | |||||||||||
| - = No Data Reported; -- = Not Applicable; NA = Not Available; W = Withheld to avoid disclosure of individual company data. |
| Release Date: 3/29/2024 |
| Next Release Date: 4/30/2024 |