|
Download Data (XLS File) |
|
||||||||
|
||||||||
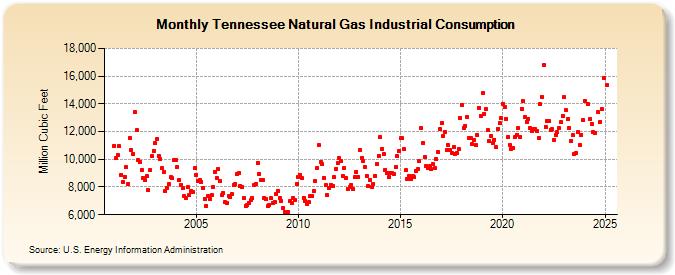
| Tennessee Natural Gas Industrial Consumption (Million Cubic Feet) | ||||||||
| Year | Jan | Feb | Mar | Apr | May | Jun | Jul | Aug | Sep | Oct | Nov | Dec |
|---|---|---|---|---|---|---|---|---|---|---|---|---|
| 2001 | 10,974 | 10,081 | 10,280 | 10,930 | 8,891 | 8,385 | 8,749 | 9,419 | 8,227 | 11,542 | 10,696 | 10,391 |
| 2002 | 13,400 | 12,094 | 9,944 | 9,816 | 9,251 | 8,682 | 8,484 | 8,782 | 7,748 | 9,208 | 10,219 | 10,610 |
| 2003 | 11,144 | 11,487 | 10,262 | 9,997 | 9,368 | 9,088 | 7,711 | 7,948 | 8,204 | 8,695 | 8,620 | 9,922 |
| 2004 | 9,949 | 9,441 | 8,515 | 8,177 | 7,916 | 7,359 | 7,202 | 7,978 | 7,432 | 7,728 | 7,632 | 9,372 |
| 2005 | 8,885 | 8,462 | 8,505 | 8,382 | 7,919 | 7,117 | 6,636 | 7,363 | 7,098 | 7,399 | 8,031 | 9,101 |
| 2006 | 8,651 | 9,286 | 8,448 | 7,409 | 7,578 | 6,884 | 6,853 | 7,350 | 7,256 | 7,489 | 8,158 | 8,238 |
| 2007 | 8,909 | 8,978 | 8,095 | 7,965 | 7,189 | 6,621 | 6,714 | 6,881 | 7,026 | 7,175 | 8,123 | 8,248 |
| 2008 | 9,753 | 8,972 | 8,527 | 8,469 | 7,224 | 7,098 | 6,611 | 6,714 | 7,174 | 6,875 | 6,939 | 7,478 |
| 2009 | 7,747 | 7,207 | 6,992 | 6,489 | 6,197 | 6,142 | 6,211 | 6,969 | 6,828 | 7,221 | 7,071 | 8,239 |
| 2010 | 8,718 | 8,856 | 8,613 | 7,241 | 7,020 | 6,804 | 6,882 | 7,350 | 7,345 | 7,705 | 8,422 | 9,365 |
| 2011 | 11,015 | 9,820 | 9,635 | 8,667 | 8,111 | 7,393 | 7,906 | 8,158 | 8,075 | 8,700 | 9,332 | 9,711 |
| 2012 | 10,064 | 9,873 | 8,778 | 9,344 | 8,630 | 7,845 | 7,977 | 8,155 | 7,826 | 8,710 | 9,091 | 8,752 |
| 2013 | 10,697 | 10,119 | 9,890 | 9,465 | 8,788 | 8,059 | 8,510 | 8,020 | 8,205 | 8,805 | 9,645 | 10,270 |
| 2014 | 11,624 | 10,749 | 10,346 | 9,241 | 9,014 | 8,705 | 9,000 | 8,985 | 8,952 | 9,441 | 10,235 | 10,591 |
| 2015 | 11,513 | 11,510 | 10,717 | 9,194 | 8,581 | 8,801 | 8,574 | 8,767 | 8,716 | 9,190 | 9,276 | 9,843 |
| 2016 | 12,233 | 11,181 | 10,158 | 9,550 | 9,394 | 9,493 | 9,289 | 9,638 | 9,338 | 9,986 | 10,532 | 12,160 |
| 2017 | 12,606 | 11,690 | 11,986 | 10,668 | 11,029 | 10,636 | 10,471 | 10,888 | 10,399 | 10,480 | 10,713 | 12,989 |
| 2018 | 13,945 | 12,280 | 12,423 | 13,050 | 11,519 | 11,544 | 11,090 | 11,416 | 11,014 | 11,736 | 13,713 | 13,158 |
| 2019 | 14,759 | 13,300 | 13,645 | 12,080 | 11,300 | 11,694 | 11,164 | 11,413 | 10,856 | 12,191 | 12,586 | 12,970 |
| 2020 | 14,008 | 13,785 | 12,940 | 11,636 | 11,020 | 10,775 | 10,805 | 11,581 | 11,771 | 12,240 | 11,633 | 13,662 |
| 2021 | 14,184 | 13,074 | 12,721 | 12,894 | 12,230 | 12,048 | 12,209 | 12,177 | 12,019 | 11,526 | 13,969 | 14,516 |
| 2022 | 16,818 | 12,347 | 12,790 | 12,741 | 12,129 | 12,159 | 11,420 | 11,743 | 11,943 | 12,236 | 12,658 | 13,148 |
| 2023 | 14,539 | 13,578 | 12,945 | 12,302 | 11,392 | NA | NA | 10,502 | 11,992 | NA | NA | NA |
| 2024 | NA | |||||||||||
| - = No Data Reported; -- = Not Applicable; NA = Not Available; W = Withheld to avoid disclosure of individual company data. |
| Release Date: 3/29/2024 |
| Next Release Date: 4/30/2024 |