|
Download Data (XLS File) |
|
||||||||
|
||||||||
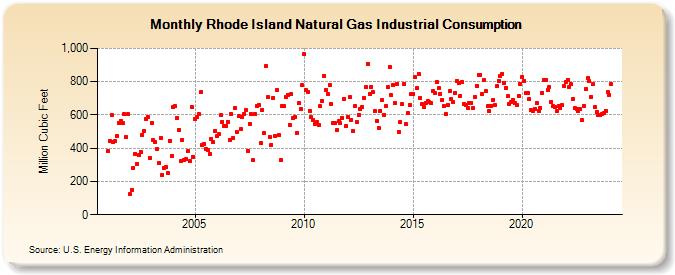
| Rhode Island Natural Gas Industrial Consumption (Million Cubic Feet) | ||||||||
| Year | Jan | Feb | Mar | Apr | May | Jun | Jul | Aug | Sep | Oct | Nov | Dec |
|---|---|---|---|---|---|---|---|---|---|---|---|---|
| 2001 | 382 | 444 | 601 | 437 | 443 | 474 | 553 | 565 | 550 | 606 | 468 | 604 |
| 2002 | 122 | 149 | 283 | 367 | 306 | 359 | 379 | 481 | 502 | 578 | 588 | 342 |
| 2003 | 550 | 448 | 438 | 396 | 309 | 462 | 239 | 278 | 284 | 249 | 445 | 354 |
| 2004 | 649 | 651 | 584 | 511 | 321 | 451 | 329 | 332 | 382 | 322 | 648 | 350 |
| 2005 | 573 | 587 | 605 | 736 | 417 | 423 | 397 | 389 | 368 | 457 | 436 | 503 |
| 2006 | 472 | 485 | 598 | 560 | 533 | 536 | 559 | 449 | 606 | 461 | 642 | 496 |
| 2007 | 591 | 514 | 588 | 606 | 628 | 385 | 546 | 603 | 327 | 605 | 654 | 660 |
| 2008 | 429 | 630 | 491 | 895 | 705 | 470 | 420 | 704 | 473 | 749 | 480 | 328 |
| 2009 | 651 | 651 | 708 | 721 | 540 | 725 | 580 | 590 | 492 | 669 | 635 | 778 |
| 2010 | 964 | 747 | 735 | 624 | 588 | 568 | 544 | 556 | 537 | 651 | 685 | 835 |
| 2011 | 752 | 725 | 781 | 665 | 554 | 551 | 509 | 563 | 549 | 584 | 696 | 533 |
| 2012 | 589 | 705 | 572 | 503 | 652 | 559 | 600 | 635 | 648 | 701 | 769 | 908 |
| 2013 | 726 | 770 | 735 | 622 | 564 | 522 | 625 | 687 | 599 | 653 | 767 | 891 |
| 2014 | 717 | 782 | 673 | 787 | 499 | 557 | 664 | 786 | 545 | 610 | 660 | 727 |
| 2015 | 728 | 826 | 760 | 848 | 701 | 666 | 650 | 673 | 686 | 675 | 669 | 742 |
| 2016 | 730 | 799 | 760 | 728 | 691 | 652 | 605 | 662 | 742 | 694 | 677 | 734 |
| 2017 | 806 | 791 | 716 | 799 | 666 | 660 | 644 | 672 | 673 | 641 | 709 | 773 |
| 2018 | 842 | 843 | 727 | 809 | 741 | 652 | 623 | 656 | 692 | 659 | 771 | 803 |
| 2019 | 835 | 848 | 794 | 763 | 712 | 666 | 680 | 690 | 670 | 661 | 714 | 786 |
| 2020 | 830 | 805 | 733 | 734 | 693 | 631 | 624 | 638 | 672 | 626 | 643 | 732 |
| 2021 | 808 | 812 | 750 | 768 | 680 | 652 | 646 | 621 | 653 | 640 | 657 | 772 |
| 2022 | 800 | 810 | 768 | 784 | 697 | 640 | 635 | 624 | 633 | 568 | 654 | 757 |
| 2023 | 819 | 803 | 710 | 784 | 646 | 619 | 598 | 600 | 608 | 611 | 626 | 737 |
| 2024 | 719 | 784 | ||||||||||
| - = No Data Reported; -- = Not Applicable; NA = Not Available; W = Withheld to avoid disclosure of individual company data. |
| Release Date: 4/30/2024 |
| Next Release Date: 5/31/2024 |