|
Download Data (XLS File) |
|
||||||||
|
||||||||
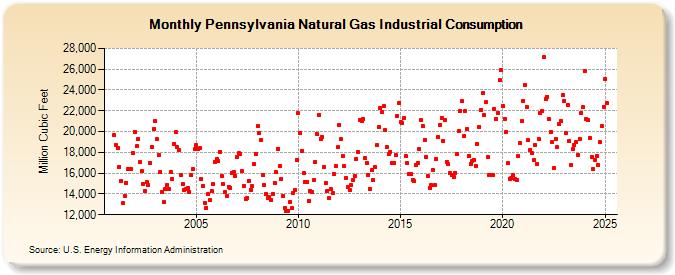
| Pennsylvania Natural Gas Industrial Consumption (Million Cubic Feet) | ||||||||
| Year | Jan | Feb | Mar | Apr | May | Jun | Jul | Aug | Sep | Oct | Nov | Dec |
|---|---|---|---|---|---|---|---|---|---|---|---|---|
| 2001 | 19,623 | 18,719 | 18,460 | 16,607 | 15,205 | 13,093 | 13,764 | 15,092 | 16,432 | 16,385 | 16,402 | 17,894 |
| 2002 | 19,982 | 18,572 | 19,291 | 17,038 | 16,175 | 14,999 | 14,256 | 15,136 | 14,848 | 17,010 | 18,503 | 20,224 |
| 2003 | 20,995 | 19,250 | 17,751 | 16,102 | 14,232 | 13,196 | 14,483 | 14,851 | 14,443 | 16,113 | 15,448 | 18,838 |
| 2004 | 19,918 | 18,492 | 18,188 | 15,863 | 14,925 | 14,380 | 14,436 | 14,532 | 14,192 | 15,787 | 16,362 | 18,274 |
| 2005 | 18,700 | 18,314 | 18,377 | 15,412 | 14,772 | 13,145 | 12,685 | 13,962 | 13,370 | 14,251 | 14,919 | 17,097 |
| 2006 | 17,398 | 17,151 | 18,059 | 15,765 | 14,948 | 14,215 | 13,782 | 14,679 | 14,607 | 16,060 | 16,141 | 15,728 |
| 2007 | 17,515 | 17,929 | 17,851 | 16,161 | 14,739 | 13,525 | 13,652 | 15,270 | 14,390 | 14,734 | 16,878 | 17,879 |
| 2008 | 20,543 | 19,840 | 19,232 | 15,818 | 14,842 | 14,003 | 13,570 | 13,675 | 13,402 | 14,020 | 15,098 | 16,082 |
| 2009 | 18,350 | 16,643 | 15,477 | 13,817 | 12,649 | 12,388 | 12,364 | 13,232 | 12,603 | 14,130 | 14,378 | 17,292 |
| 2010 | 21,745 | 19,824 | 18,134 | 16,012 | 15,166 | 15,189 | 13,329 | 14,271 | 14,224 | 15,296 | 17,092 | 19,734 |
| 2011 | 21,620 | 19,284 | 19,515 | 16,587 | 15,060 | 14,326 | 13,572 | 14,467 | 14,075 | 15,946 | 16,674 | 18,469 |
| 2012 | 20,625 | 19,273 | 17,650 | 16,646 | 15,579 | 14,639 | 14,377 | 14,834 | 15,369 | 15,756 | 17,367 | 18,054 |
| 2013 | 21,099 | 21,027 | 21,251 | 17,426 | 17,022 | 15,814 | 14,474 | 16,284 | 15,295 | 16,569 | 18,668 | 20,477 |
| 2014 | 22,293 | 21,872 | 22,444 | 20,145 | 18,532 | 17,806 | 18,036 | 16,936 | 16,950 | 17,768 | 21,493 | 22,738 |
| 2015 | 20,905 | 20,789 | 21,257 | 17,645 | 16,938 | 15,935 | 15,910 | 15,364 | 15,240 | 16,747 | 17,002 | 18,318 |
| 2016 | 21,103 | 20,507 | 19,230 | 17,592 | 15,741 | 14,580 | 14,825 | 16,265 | 14,881 | 17,368 | 19,496 | 20,665 |
| 2017 | 21,328 | 19,124 | 21,134 | 17,108 | 16,859 | 16,009 | 15,838 | 15,651 | 16,014 | 17,855 | 20,087 | 22,021 |
| 2018 | 22,907 | 19,535 | 21,988 | 20,235 | 17,673 | 16,879 | 17,162 | 17,300 | 16,711 | 18,838 | 20,478 | 22,028 |
| 2019 | 23,684 | 21,600 | 22,814 | 17,530 | 15,839 | 15,785 | 15,781 | 22,163 | 21,167 | 21,790 | 24,914 | 25,958 |
| 2020 | 22,449 | 21,247 | 19,943 | 16,941 | 15,483 | 15,551 | 15,800 | 15,400 | 15,294 | 17,670 | 18,882 | 21,004 |
| 2021 | 22,939 | 24,443 | 22,362 | 19,169 | 18,271 | 17,903 | 17,234 | 18,704 | 16,851 | 19,291 | 21,791 | 21,950 |
| 2022 | 27,144 | 23,131 | 23,361 | 21,176 | 19,945 | 18,966 | 16,481 | 19,291 | 18,477 | 20,687 | 21,054 | 23,475 |
| 2023 | 25,211 | 21,749 | 24,737 | NA | 18,382 | 20,070 | 20,509 | 20,828 | 19,490 | 21,170 | 23,909 | 24,491 |
| 2024 | 25,721 | 21,082 | ||||||||||
| - = No Data Reported; -- = Not Applicable; NA = Not Available; W = Withheld to avoid disclosure of individual company data. |
| Release Date: 4/30/2024 |
| Next Release Date: 5/31/2024 |