|
Download Data (XLS File) |
|
||||||||
|
||||||||
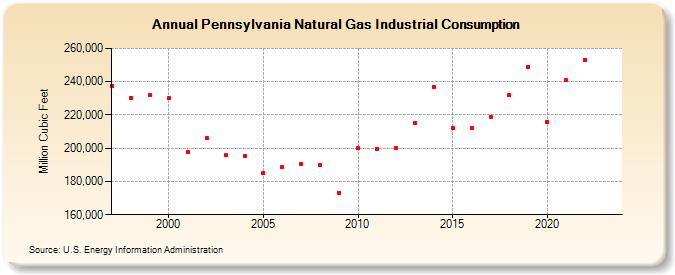
| Pennsylvania Natural Gas Industrial Consumption (Million Cubic Feet) | ||||||||
| Decade | Year-0 | Year-1 | Year-2 | Year-3 | Year-4 | Year-5 | Year-6 | Year-7 | Year-8 | Year-9 |
|---|---|---|---|---|---|---|---|---|---|---|
| 1990's | 237,583 | 230,376 | 231,817 | |||||||
| 2000's | 230,008 | 197,676 | 206,034 | 195,702 | 195,349 | 185,004 | 188,533 | 190,524 | 190,126 | 173,323 |
| 2010's | 200,016 | 199,594 | 200,169 | 215,406 | 237,013 | 212,050 | 212,253 | 219,028 | 231,734 | 249,026 |
| 2020's | 215,664 | 240,907 | 253,189 | NA |
| - = No Data Reported; -- = Not Applicable; NA = Not Available; W = Withheld to avoid disclosure of individual company data. |
| Release Date: 3/29/2024 |
| Next Release Date: 4/30/2024 |