|
Download Data (XLS File) |
|
||||||||
|
||||||||
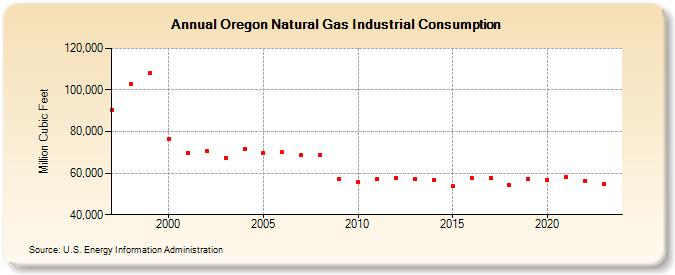
| Oregon Natural Gas Industrial Consumption (Million Cubic Feet) | ||||||||
| Decade | Year-0 | Year-1 | Year-2 | Year-3 | Year-4 | Year-5 | Year-6 | Year-7 | Year-8 | Year-9 |
|---|---|---|---|---|---|---|---|---|---|---|
| 1990's | 90,403 | 102,770 | 107,984 | |||||||
| 2000's | 76,273 | 69,866 | 70,510 | 67,519 | 71,687 | 69,645 | 70,091 | 68,813 | 68,785 | 57,318 |
| 2010's | 55,822 | 56,977 | 57,506 | 57,372 | 56,522 | 53,632 | 57,760 | 57,849 | 54,267 | 57,008 |
| 2020's | 56,700 | 58,109 | 56,406 | 54,757 |
| - = No Data Reported; -- = Not Applicable; NA = Not Available; W = Withheld to avoid disclosure of individual company data. |
| Release Date: 3/29/2024 |
| Next Release Date: 4/30/2024 |