|
Download Data (XLS File) |
|
||||||||
|
||||||||
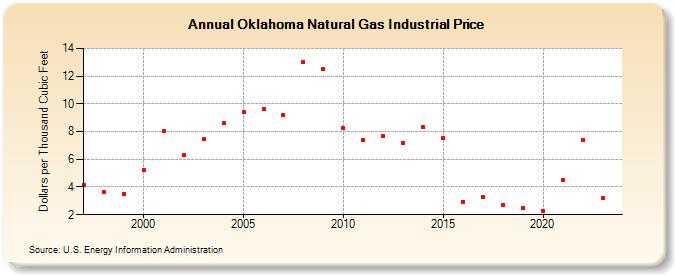
| Oklahoma Natural Gas Industrial Price (Dollars per Thousand Cubic Feet) | ||||||||
| Decade | Year-0 | Year-1 | Year-2 | Year-3 | Year-4 | Year-5 | Year-6 | Year-7 | Year-8 | Year-9 |
|---|---|---|---|---|---|---|---|---|---|---|
| 1990's | 4.16 | 3.65 | 3.51 | |||||||
| 2000's | 5.24 | 8.07 | 6.28 | 7.45 | 8.59 | 9.41 | 9.66 | 9.18 | 13.03 | 12.53 |
| 2010's | 8.23 | 7.37 | 7.65 | 7.16 | 8.30 | 7.51 | 2.94 | 3.30 | 2.67 | 2.50 |
| 2020's | 2.29 | 4.52 | 7.38 | 3.17 |
| - = No Data Reported; -- = Not Applicable; NA = Not Available; W = Withheld to avoid disclosure of individual company data. |
| Release Date: 3/29/2024 |
| Next Release Date: 4/30/2024 |