|
Download Data (XLS File) |
|
||||||||
|
||||||||
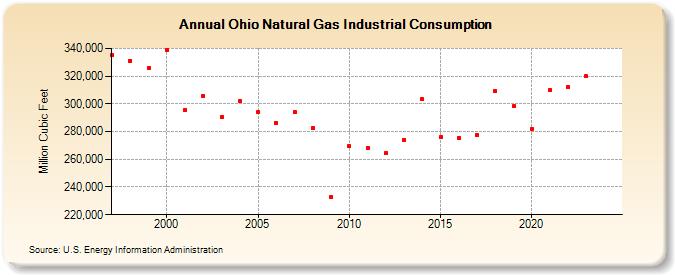
| Ohio Natural Gas Industrial Consumption (Million Cubic Feet) | ||||||||
| Decade | Year-0 | Year-1 | Year-2 | Year-3 | Year-4 | Year-5 | Year-6 | Year-7 | Year-8 | Year-9 |
|---|---|---|---|---|---|---|---|---|---|---|
| 1990's | 334,874 | 331,122 | 325,887 | |||||||
| 2000's | 339,060 | 295,556 | 305,883 | 290,483 | 302,023 | 293,985 | 286,487 | 293,976 | 282,834 | 232,632 |
| 2010's | 269,287 | 268,034 | 264,405 | 274,020 | 303,366 | 276,004 | 275,358 | 277,767 | 309,181 | 298,171 |
| 2020's | 282,004 | 310,019 | 311,998 | 318,825 |
| - = No Data Reported; -- = Not Applicable; NA = Not Available; W = Withheld to avoid disclosure of individual company data. |
| Release Date: 4/30/2024 |
| Next Release Date: 5/31/2024 |