|
Download Data (XLS File) |
|
||||||||
|
||||||||
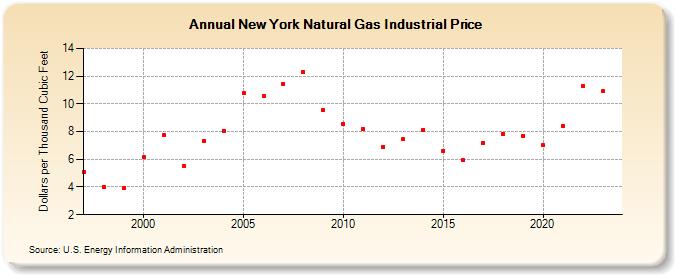
| New York Natural Gas Industrial Price (Dollars per Thousand Cubic Feet) | ||||||||
| Decade | Year-0 | Year-1 | Year-2 | Year-3 | Year-4 | Year-5 | Year-6 | Year-7 | Year-8 | Year-9 |
|---|---|---|---|---|---|---|---|---|---|---|
| 1990's | 5.05 | 4.02 | 3.90 | |||||||
| 2000's | 6.14 | 7.72 | 5.53 | 7.35 | 8.05 | 10.76 | 10.56 | 11.43 | 12.30 | 9.52 |
| 2010's | 8.55 | 8.18 | 6.92 | 7.44 | 8.13 | 6.62 | 5.92 | 7.21 | 7.83 | 7.70 |
| 2020's | 7.00 | 8.38 | 11.30 | 10.89 |
| - = No Data Reported; -- = Not Applicable; NA = Not Available; W = Withheld to avoid disclosure of individual company data. |
| Release Date: 3/29/2024 |
| Next Release Date: 4/30/2024 |