|
Download Data (XLS File) |
|
||||||||
|
||||||||
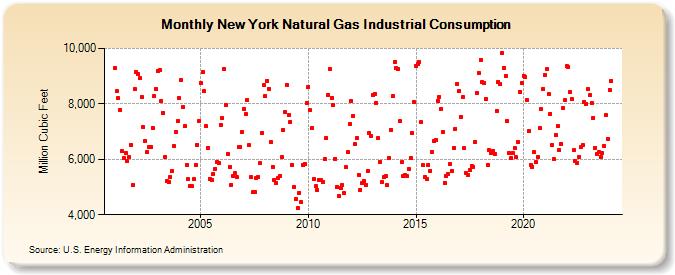
| New York Natural Gas Industrial Consumption (Million Cubic Feet) | ||||||||
| Year | Jan | Feb | Mar | Apr | May | Jun | Jul | Aug | Sep | Oct | Nov | Dec |
|---|---|---|---|---|---|---|---|---|---|---|---|---|
| 2001 | 9,291 | 8,449 | 8,204 | 7,788 | 6,281 | 6,030 | 6,233 | 5,925 | 6,076 | 6,531 | 5,076 | 8,527 |
| 2002 | 9,133 | 9,071 | 8,916 | 8,244 | 7,160 | 6,647 | 6,260 | 6,431 | 6,443 | 7,131 | 8,270 | 8,544 |
| 2003 | 9,195 | 9,209 | 8,109 | 7,686 | 6,089 | 5,202 | 5,166 | 5,353 | 5,583 | 6,475 | 6,990 | 7,373 |
| 2004 | 8,193 | 8,871 | 7,888 | 7,187 | 5,808 | 5,275 | 5,038 | 5,033 | 5,282 | 5,802 | 6,528 | 7,384 |
| 2005 | 8,745 | 9,156 | 8,450 | 7,189 | 6,419 | 5,305 | 5,258 | 5,470 | 5,650 | 5,912 | 5,875 | 7,253 |
| 2006 | 7,489 | 9,264 | 7,948 | 6,203 | 5,738 | 5,078 | 5,388 | 5,489 | 5,352 | 6,436 | 6,452 | 6,992 |
| 2007 | 7,824 | 7,633 | 8,142 | 6,504 | 5,359 | 4,803 | 4,836 | 5,330 | 5,366 | 5,850 | 6,956 | 8,670 |
| 2008 | 8,280 | 8,837 | 8,552 | 6,623 | 5,732 | 5,246 | 5,138 | 5,324 | 5,408 | 6,064 | 7,072 | 7,691 |
| 2009 | 8,687 | 7,591 | 7,357 | 5,811 | 5,007 | 4,564 | 4,239 | 4,794 | 4,464 | 5,785 | 5,838 | 8,031 |
| 2010 | 8,617 | 7,761 | 7,126 | 5,288 | 5,018 | 4,890 | 5,262 | 5,236 | 5,181 | 5,996 | 6,770 | 8,330 |
| 2011 | 9,256 | 8,213 | 7,949 | 6,021 | 5,002 | 4,674 | 4,971 | 5,076 | 4,777 | 5,705 | 6,249 | 7,270 |
| 2012 | 8,090 | 7,567 | 6,539 | 6,771 | 5,450 | 4,908 | 5,133 | 5,215 | 5,089 | 5,592 | 6,943 | 6,835 |
| 2013 | 8,327 | 8,372 | 8,046 | 6,758 | 5,917 | 5,173 | 5,349 | 5,395 | 5,066 | 6,031 | 7,068 | 8,274 |
| 2014 | 9,507 | 9,286 | 9,260 | 7,366 | 5,892 | 5,395 | 5,448 | 5,393 | 5,652 | 6,048 | 6,942 | 8,066 |
| 2015 | 9,379 | 9,427 | 9,509 | 7,332 | 5,776 | 5,363 | 5,279 | 5,803 | 5,594 | 6,256 | 6,657 | 6,684 |
| 2016 | 8,114 | 8,250 | 7,821 | 6,993 | 5,161 | 5,384 | 5,452 | 5,835 | 5,591 | 6,423 | 7,103 | 8,722 |
| 2017 | 8,470 | 7,540 | 8,240 | 6,389 | 5,520 | 5,450 | 5,610 | 5,769 | 5,716 | 6,619 | 8,395 | 9,130 |
| 2018 | 9,592 | 8,779 | 8,752 | 8,180 | 5,806 | 6,320 | 6,236 | 6,302 | 6,208 | 7,755 | 8,799 | 8,700 |
| 2019 | 9,842 | 9,303 | 9,012 | 7,369 | 6,240 | 6,041 | 6,223 | 6,410 | 6,067 | 6,628 | 8,435 | 8,759 |
| 2020 | 9,016 | 8,980 | 8,137 | 7,015 | 5,803 | 5,731 | 6,259 | 5,895 | 6,096 | 7,125 | 7,802 | 8,541 |
| 2021 | 9,046 | 9,240 | 8,360 | 7,647 | 6,504 | 5,996 | 6,874 | 7,208 | 6,337 | 6,565 | 7,832 | 8,122 |
| 2022 | 9,353 | 9,335 | 8,427 | 8,169 | 6,320 | 5,928 | 5,877 | 6,083 | 6,433 | 6,530 | 8,076 | 8,009 |
| 2023 | 8,538 | 8,301 | 8,032 | 7,505 | 6,424 | 6,182 | 6,245 | 6,085 | 6,216 | 6,493 | 7,590 | 6,737 |
| 2024 | 8,512 | 8,834 | ||||||||||
| - = No Data Reported; -- = Not Applicable; NA = Not Available; W = Withheld to avoid disclosure of individual company data. |
| Release Date: 4/30/2024 |
| Next Release Date: 5/31/2024 |