|
Download Data (XLS File) |
|
||||||||
|
||||||||
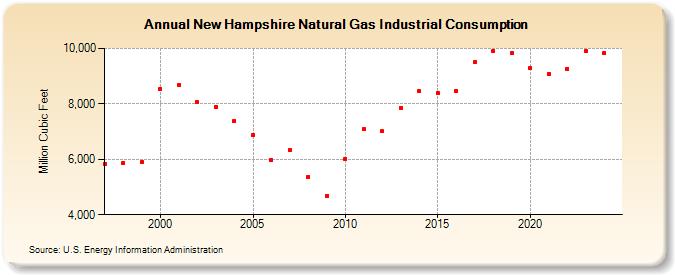
| New Hampshire Natural Gas Industrial Consumption (Million Cubic Feet) | ||||||||
| Decade | Year-0 | Year-1 | Year-2 | Year-3 | Year-4 | Year-5 | Year-6 | Year-7 | Year-8 | Year-9 |
|---|---|---|---|---|---|---|---|---|---|---|
| 1990's | 5,830 | 5,878 | 5,912 | |||||||
| 2000's | 8,537 | 8,685 | 8,054 | 7,882 | 7,388 | 6,889 | 5,968 | 6,337 | 5,370 | 4,688 |
| 2010's | 6,022 | 7,083 | 7,007 | 7,866 | 8,456 | 8,386 | 8,454 | 9,499 | 9,916 | 9,834 |
| 2020's | 9,293 | 9,082 | 9,267 | NA |
| - = No Data Reported; -- = Not Applicable; NA = Not Available; W = Withheld to avoid disclosure of individual company data. |
| Release Date: 3/29/2024 |
| Next Release Date: 4/30/2024 |