|
Download Data (XLS File) |
|
||||||||
|
||||||||
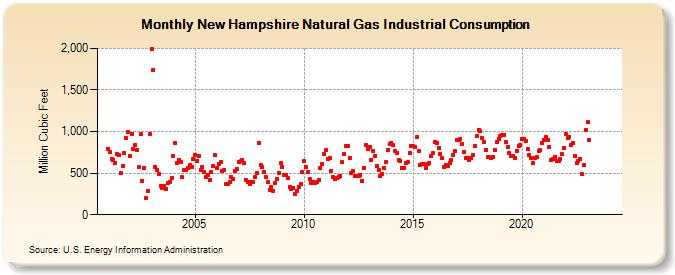
| New Hampshire Natural Gas Industrial Consumption (Million Cubic Feet) | ||||||||
| Year | Jan | Feb | Mar | Apr | May | Jun | Jul | Aug | Sep | Oct | Nov | Dec |
|---|---|---|---|---|---|---|---|---|---|---|---|---|
| 2001 | 793 | 750 | 672 | 660 | 618 | 734 | 724 | 503 | 582 | 737 | 921 | 990 |
| 2002 | 704 | 974 | 795 | 835 | 775 | 575 | 966 | 411 | 562 | 202 | 290 | 966 |
| 2003 | 1,992 | 1,740 | 579 | 537 | 495 | 351 | 319 | 343 | 307 | 380 | 398 | 440 |
| 2004 | 701 | 865 | 623 | 652 | 632 | 449 | 533 | 540 | 557 | 597 | 575 | 665 |
| 2005 | 724 | 650 | 712 | 541 | 571 | 514 | 455 | 479 | 416 | 515 | 591 | 721 |
| 2006 | 557 | 614 | 632 | 530 | 538 | 374 | 367 | 399 | 453 | 430 | 531 | 544 |
| 2007 | 639 | 641 | 663 | 616 | 420 | 388 | 371 | 390 | 388 | 457 | 500 | 865 |
| 2008 | 593 | 571 | 517 | 450 | 389 | 301 | 333 | 287 | 379 | 432 | 502 | 618 |
| 2009 | 570 | 478 | 482 | 436 | 334 | 314 | 326 | 252 | 286 | 336 | 364 | 509 |
| 2010 | 643 | 570 | 509 | 424 | 386 | 391 | 384 | 396 | 417 | 564 | 608 | 731 |
| 2011 | 774 | 668 | 676 | 529 | 449 | 432 | 444 | 457 | 471 | 628 | 727 | 826 |
| 2012 | 827 | 687 | 499 | 523 | 468 | 468 | 460 | 480 | 405 | 560 | 841 | 788 |
| 2013 | 816 | 660 | 768 | 710 | 586 | 542 | 464 | 491 | 557 | 639 | 784 | 850 |
| 2014 | 861 | 838 | 765 | 743 | 655 | 648 | 564 | 563 | 626 | 628 | 741 | 826 |
| 2015 | 823 | 812 | 930 | 764 | 598 | 611 | 606 | 566 | 605 | 619 | 709 | 743 |
| 2016 | 869 | 862 | 803 | 726 | 680 | 568 | 593 | 587 | 623 | 653 | 722 | 768 |
| 2017 | 895 | 904 | 909 | 847 | 755 | 678 | 682 | 662 | 679 | 724 | 822 | 941 |
| 2018 | 1,022 | 1,002 | 919 | 874 | 781 | 691 | 689 | 681 | 696 | 780 | 876 | 906 |
| 2019 | 942 | 961 | 963 | 877 | 814 | 748 | 708 | 710 | 686 | 768 | 821 | 838 |
| 2020 | 910 | 910 | 885 | 788 | 720 | 683 | 620 | 685 | 689 | 767 | 774 | 861 |
| 2021 | 904 | 932 | 902 | 817 | 655 | 674 | 698 | 651 | 647 | 674 | 728 | 802 |
| 2022 | 965 | 917 | 935 | 841 | 860 | 710 | 625 | 650 | 670 | 485 | 595 | 1,014 |
| 2023 | 1,110 | 903 | NA | NA | NA | NA | NA | NA | NA | NA | NA | NA |
| 2024 | NA | |||||||||||
| - = No Data Reported; -- = Not Applicable; NA = Not Available; W = Withheld to avoid disclosure of individual company data. |
| Release Date: 3/29/2024 |
| Next Release Date: 4/30/2024 |