|
Download Data (XLS File) |
|
||||||||
|
||||||||
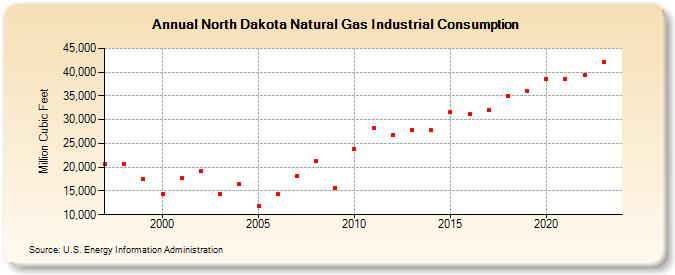
| North Dakota Natural Gas Industrial Consumption (Million Cubic Feet) | ||||||||
| Decade | Year-0 | Year-1 | Year-2 | Year-3 | Year-4 | Year-5 | Year-6 | Year-7 | Year-8 | Year-9 |
|---|---|---|---|---|---|---|---|---|---|---|
| 1990's | 20,580 | 20,606 | 17,561 | |||||||
| 2000's | 14,423 | 17,759 | 19,101 | 14,449 | 16,409 | 11,841 | 14,302 | 18,117 | 21,255 | 15,680 |
| 2010's | 23,762 | 28,303 | 26,680 | 27,812 | 27,762 | 31,660 | 31,232 | 32,127 | 35,072 | 36,093 |
| 2020's | 38,496 | 38,461 | 39,492 | 42,103 |
| - = No Data Reported; -- = Not Applicable; NA = Not Available; W = Withheld to avoid disclosure of individual company data. |
| Release Date: 8/30/2024 |
| Next Release Date: 9/30/2024 |