|
Download Data (XLS File) |
|
||||||||
|
||||||||
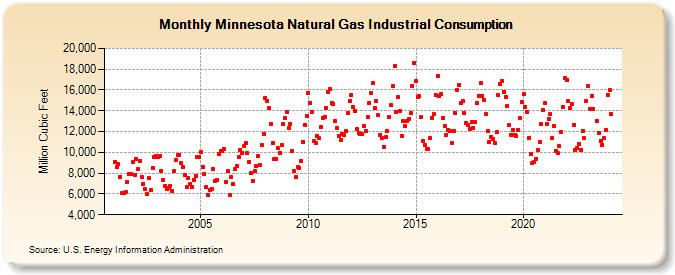
| Minnesota Natural Gas Industrial Consumption (Million Cubic Feet) | ||||||||
| Year | Jan | Feb | Mar | Apr | May | Jun | Jul | Aug | Sep | Oct | Nov | Dec |
|---|---|---|---|---|---|---|---|---|---|---|---|---|
| 2001 | 9,110 | 8,557 | 8,841 | 7,676 | 6,052 | 6,046 | 6,202 | 7,183 | 7,926 | 7,945 | 9,056 | 7,858 |
| 2002 | 9,366 | 8,391 | 9,188 | 7,661 | 7,001 | 6,431 | 6,011 | 7,494 | 6,376 | 8,535 | 9,542 | 9,675 |
| 2003 | 9,539 | 9,625 | 8,206 | 7,310 | 6,802 | 6,487 | 6,575 | 6,769 | 6,284 | 8,202 | 9,271 | 9,703 |
| 2004 | 9,787 | 8,941 | 8,594 | 7,829 | 6,637 | 7,549 | 6,968 | 6,623 | 7,309 | 7,714 | 9,582 | 9,571 |
| 2005 | 10,057 | 8,561 | 7,940 | 6,667 | 5,872 | 6,386 | 6,507 | 8,372 | 7,268 | 7,383 | 9,850 | 10,127 |
| 2006 | 10,085 | 10,344 | 7,172 | 8,168 | 5,878 | 7,623 | 6,931 | 8,396 | 8,661 | 9,540 | 10,239 | 9,972 |
| 2007 | 10,586 | 10,890 | 9,901 | 9,114 | 7,975 | 7,235 | 8,161 | 8,653 | 9,689 | 8,793 | 10,708 | 11,800 |
| 2008 | 15,273 | 14,928 | 14,282 | 12,688 | 10,910 | 9,361 | 9,363 | 10,376 | 9,975 | 10,685 | 12,702 | 13,293 |
| 2009 | 13,926 | 12,320 | 12,736 | 10,165 | 8,171 | 7,627 | 8,587 | 8,526 | 9,150 | 10,980 | 12,632 | 13,542 |
| 2010 | 15,745 | 14,733 | 13,895 | 11,057 | 10,874 | 11,527 | 11,342 | 12,425 | 13,334 | 13,412 | 14,310 | 15,802 |
| 2011 | 16,134 | 14,773 | 14,630 | 13,004 | 12,346 | 11,548 | 11,146 | 11,741 | 11,644 | 12,047 | 13,810 | 14,954 |
| 2012 | 15,500 | 14,380 | 13,982 | 12,267 | 11,905 | 11,796 | 11,737 | 12,531 | 12,010 | 13,364 | 14,761 | 15,713 |
| 2013 | 16,647 | 14,251 | 14,923 | 13,546 | 11,711 | 11,398 | 10,520 | 11,444 | 12,019 | 13,383 | 14,530 | 16,359 |
| 2014 | 18,294 | 13,888 | 15,286 | 13,976 | 11,580 | 13,013 | 12,493 | 12,991 | 13,227 | 13,805 | 16,406 | 18,611 |
| 2015 | 16,822 | 15,370 | 15,419 | 13,355 | 11,133 | 10,718 | 10,333 | 10,324 | 11,362 | 13,347 | 13,674 | 15,545 |
| 2016 | 17,372 | 15,388 | 15,566 | 13,333 | 12,504 | 11,710 | 12,192 | 12,081 | 10,872 | 12,022 | 13,777 | 16,003 |
| 2017 | 16,474 | 14,740 | 14,916 | 13,739 | 12,861 | 12,624 | 12,246 | 12,907 | 12,347 | 12,890 | 14,746 | 15,411 |
| 2018 | 16,705 | 15,435 | 15,028 | 13,719 | 12,085 | 10,972 | 11,502 | 11,244 | 10,920 | 11,930 | 15,490 | 16,530 |
| 2019 | 16,897 | 15,847 | 15,280 | 14,446 | 12,616 | 11,675 | 12,139 | 11,685 | 11,528 | 12,178 | 13,285 | 14,863 |
| 2020 | 15,577 | 14,402 | 13,893 | 11,376 | 9,817 | 8,989 | 9,101 | 9,403 | 10,208 | 10,973 | 12,696 | 14,119 |
| 2021 | 14,722 | 12,742 | 13,213 | 13,699 | 11,383 | 12,543 | 10,176 | 9,889 | 10,568 | 11,929 | 14,394 | 17,120 |
| 2022 | 16,979 | 14,902 | 14,246 | 14,619 | 12,641 | 10,232 | 10,385 | 10,788 | 10,254 | 12,068 | 11,366 | 14,938 |
| 2023 | 16,399 | 14,194 | 13,870 | 14,108 | NA | 10,976 | 11,328 | 11,805 | 10,735 | 11,340 | 12,193 | 15,512 |
| 2024 | 16,005 | |||||||||||
| - = No Data Reported; -- = Not Applicable; NA = Not Available; W = Withheld to avoid disclosure of individual company data. |
| Release Date: 3/29/2024 |
| Next Release Date: 4/30/2024 |