|
Download Data (XLS File) |
|
||||||||
|
||||||||
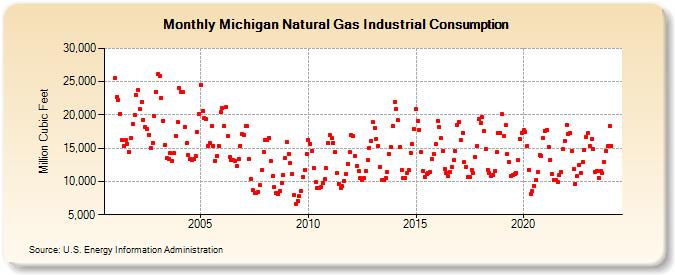
| Michigan Natural Gas Industrial Consumption (Million Cubic Feet) | ||||||||
| Year | Jan | Feb | Mar | Apr | May | Jun | Jul | Aug | Sep | Oct | Nov | Dec |
|---|---|---|---|---|---|---|---|---|---|---|---|---|
| 2001 | 25,494 | 22,752 | 22,291 | 20,181 | 16,240 | 15,260 | 16,263 | 15,666 | 14,433 | 16,600 | 18,669 | 20,006 |
| 2002 | 23,016 | 23,762 | 20,891 | 21,878 | 19,293 | 18,230 | 17,903 | 17,019 | 15,021 | 15,825 | 19,810 | 23,485 |
| 2003 | 26,081 | 25,855 | 22,526 | 19,100 | 15,427 | 13,472 | 13,400 | 14,298 | 13,093 | 14,244 | 16,883 | 18,873 |
| 2004 | 24,023 | 23,433 | 23,399 | 18,226 | 15,843 | 14,028 | 13,355 | 13,293 | 13,411 | 13,883 | 17,417 | 20,190 |
| 2005 | 24,423 | 20,656 | 19,541 | 19,315 | 15,384 | 15,777 | 18,343 | 15,371 | 13,148 | 13,801 | 15,401 | 20,379 |
| 2006 | 20,975 | 18,318 | 21,135 | 16,904 | 13,629 | 13,233 | 13,156 | 13,105 | 12,264 | 13,366 | 15,347 | 17,075 |
| 2007 | 17,007 | 18,275 | 18,272 | 13,341 | 10,374 | 8,657 | 8,235 | 8,246 | 8,458 | 9,442 | 11,796 | 14,482 |
| 2008 | 16,187 | 16,228 | 16,581 | 13,053 | 10,763 | 9,182 | 8,277 | 8,039 | 8,593 | 9,779 | 11,017 | 13,483 |
| 2009 | 15,949 | 14,140 | 12,750 | 11,152 | 7,932 | 6,552 | 7,069 | 7,747 | 8,592 | 10,725 | 11,765 | 14,132 |
| 2010 | 16,295 | 15,682 | 14,580 | 12,064 | 9,863 | 9,023 | 8,946 | 9,104 | 9,783 | 10,296 | 11,975 | 15,740 |
| 2011 | 16,922 | 16,560 | 15,841 | 14,445 | 11,247 | 9,676 | 8,981 | 9,251 | 10,068 | 11,169 | 12,554 | 14,369 |
| 2012 | 16,952 | 16,778 | 13,900 | 12,388 | 11,566 | 10,517 | 10,207 | 10,445 | 11,552 | 13,185 | 15,060 | 16,042 |
| 2013 | 18,913 | 18,080 | 16,404 | 15,366 | 12,187 | 10,179 | 10,181 | 10,487 | 11,397 | 14,159 | 15,127 | 18,352 |
| 2014 | 21,924 | 20,923 | 19,186 | 15,152 | 11,733 | 10,556 | 10,577 | 11,327 | 11,680 | 14,325 | 15,580 | 17,869 |
| 2015 | 20,906 | 19,139 | 17,712 | 14,382 | 11,570 | 10,687 | 11,139 | 11,210 | 11,478 | 13,319 | 14,100 | 15,555 |
| 2016 | 19,086 | 18,123 | 16,471 | 14,586 | 11,856 | 11,265 | 10,754 | 11,474 | 12,156 | 13,227 | 14,564 | 18,444 |
| 2017 | 18,881 | 16,201 | 17,320 | 12,865 | 12,224 | 10,652 | 10,612 | 11,754 | 11,280 | 13,685 | 15,358 | 19,356 |
| 2018 | 18,764 | 19,641 | 17,609 | 14,810 | 11,778 | 11,259 | 10,874 | 11,032 | 11,536 | 14,365 | 17,266 | 17,317 |
| 2019 | 20,084 | 16,773 | 18,429 | 14,144 | 12,976 | 10,841 | 10,946 | 11,179 | 11,267 | 13,266 | 16,362 | 17,350 |
| 2020 | 17,686 | 17,450 | 15,342 | 11,787 | 8,094 | 8,515 | 9,377 | 10,233 | 11,367 | 13,929 | 13,886 | 16,483 |
| 2021 | 17,639 | 17,752 | 15,199 | 13,276 | 11,186 | 10,232 | 10,181 | 9,893 | 10,907 | 11,479 | 14,804 | 16,102 |
| 2022 | 18,511 | 17,167 | 17,240 | 14,610 | 11,834 | 9,661 | 10,783 | 12,475 | 11,268 | 12,923 | 14,753 | 16,682 |
| 2023 | 17,306 | 15,303 | 16,313 | 14,893 | 11,438 | 11,635 | 10,580 | 11,614 | 11,197 | 12,941 | 14,573 | 15,321 |
| 2024 | 18,322 | |||||||||||
| - = No Data Reported; -- = Not Applicable; NA = Not Available; W = Withheld to avoid disclosure of individual company data. |
| Release Date: 3/29/2024 |
| Next Release Date: 4/30/2024 |