|
Download Data (XLS File) |
|
||||||||
|
||||||||
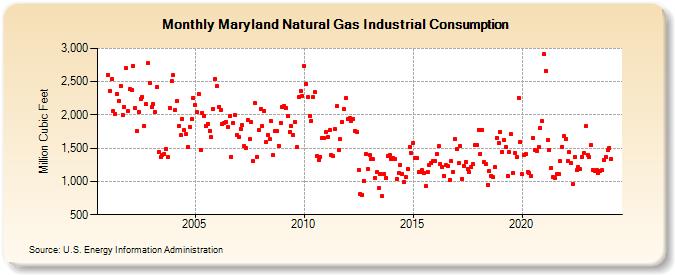
| Maryland Natural Gas Industrial Consumption (Million Cubic Feet) | ||||||||
| Year | Jan | Feb | Mar | Apr | May | Jun | Jul | Aug | Sep | Oct | Nov | Dec |
|---|---|---|---|---|---|---|---|---|---|---|---|---|
| 2001 | 2,601 | 2,365 | 2,538 | 2,053 | 2,019 | 2,312 | 2,204 | 2,437 | 1,999 | 2,117 | 2,701 | 2,065 |
| 2002 | 2,389 | 2,374 | 2,739 | 2,107 | 1,755 | 2,047 | 2,242 | 2,271 | 1,836 | 2,161 | 2,776 | 2,485 |
| 2003 | 2,121 | 2,157 | 2,041 | 2,422 | 1,445 | 1,361 | 1,395 | 1,420 | 1,487 | 1,373 | 2,102 | 2,505 |
| 2004 | 2,595 | 2,075 | 2,209 | 1,837 | 1,694 | 1,943 | 1,767 | 1,711 | 1,518 | 1,818 | 1,933 | 2,261 |
| 2005 | 2,150 | 2,038 | 2,319 | 1,477 | 2,034 | 1,988 | 1,833 | 1,870 | 1,765 | 1,662 | 2,093 | 2,542 |
| 2006 | 2,429 | 2,123 | 2,080 | 1,857 | 1,884 | 1,899 | 1,813 | 1,978 | 1,374 | 1,884 | 1,997 | 1,698 |
| 2007 | 1,665 | 1,795 | 1,842 | 1,529 | 1,502 | 1,923 | 1,638 | 1,893 | 1,307 | 2,178 | 1,369 | 1,771 |
| 2008 | 2,096 | 1,832 | 2,063 | 1,597 | 1,695 | 1,637 | 1,902 | 1,392 | 1,765 | 1,751 | 1,539 | 1,883 |
| 2009 | 2,113 | 2,136 | 2,109 | 1,984 | 1,750 | 1,830 | 1,693 | 1,894 | 1,512 | 2,266 | 2,356 | 2,283 |
| 2010 | 2,742 | 2,465 | 2,264 | 1,991 | 1,909 | 2,269 | 2,344 | 1,382 | 1,326 | 1,373 | 1,653 | 1,653 |
| 2011 | 1,742 | 1,671 | 1,768 | 1,398 | 1,386 | 1,785 | 2,132 | 1,470 | 1,631 | 1,895 | 2,085 | 2,257 |
| 2012 | 1,934 | 1,948 | 1,914 | 1,937 | 1,761 | 1,737 | 1,173 | 812 | 802 | 1,003 | 1,416 | 1,190 |
| 2013 | 1,395 | 1,330 | 1,332 | 1,052 | 1,138 | 896 | 1,117 | 775 | 1,112 | 1,059 | 1,386 | 1,396 |
| 2014 | 1,333 | 1,354 | 1,332 | 1,040 | 1,122 | 1,251 | 1,118 | 988 | 1,065 | 1,182 | 1,516 | 1,433 |
| 2015 | 1,584 | 1,353 | 1,351 | 1,135 | 1,141 | 1,168 | 1,123 | 927 | 1,140 | 1,252 | 1,277 | 1,312 |
| 2016 | 1,311 | 1,416 | 1,528 | 1,264 | 1,217 | 1,084 | 1,246 | 1,230 | 1,021 | 1,302 | 1,147 | 1,634 |
| 2017 | 1,483 | 1,276 | 1,528 | 1,041 | 1,236 | 1,299 | 1,188 | 1,137 | 1,212 | 1,259 | 1,543 | 1,543 |
| 2018 | 1,780 | 1,418 | 1,780 | 1,285 | 1,260 | 951 | 1,150 | 1,085 | 1,063 | 1,217 | 1,659 | 1,578 |
| 2019 | 1,743 | 1,445 | 1,620 | 1,520 | 1,085 | 1,439 | 1,710 | 1,130 | 1,427 | 1,367 | 2,258 | 1,591 |
| 2020 | 1,106 | 1,394 | 1,408 | 1,145 | 1,120 | 1,077 | 1,659 | 1,475 | 1,463 | 1,511 | 1,805 | 1,906 |
| 2021 | 2,909 | 2,662 | 1,619 | 1,476 | 1,205 | 1,064 | 1,058 | 1,113 | 1,114 | 1,300 | 1,524 | 1,676 |
| 2022 | 1,641 | 1,314 | 1,437 | 1,278 | 959 | 1,370 | 1,168 | 1,210 | 1,184 | 1,372 | 1,428 | 1,829 |
| 2023 | 1,395 | 1,365 | 1,549 | 1,177 | 1,152 | 1,174 | 1,120 | 1,163 | 1,167 | 1,321 | 1,371 | 1,472 |
| 2024 | 1,504 | 1,338 | ||||||||||
| - = No Data Reported; -- = Not Applicable; NA = Not Available; W = Withheld to avoid disclosure of individual company data. |
| Release Date: 4/30/2024 |
| Next Release Date: 5/31/2024 |