|
Download Data (XLS File) |
|
||||||||
|
||||||||
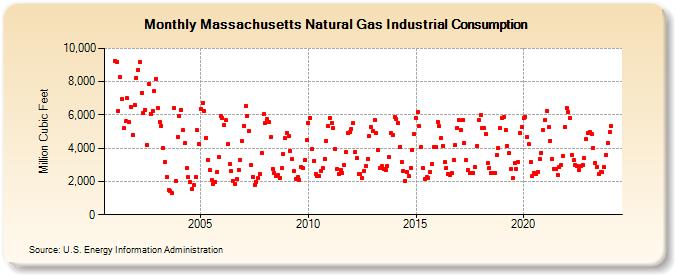
| Massachusetts Natural Gas Industrial Consumption (Million Cubic Feet) | ||||||||
| Year | Jan | Feb | Mar | Apr | May | Jun | Jul | Aug | Sep | Oct | Nov | Dec |
|---|---|---|---|---|---|---|---|---|---|---|---|---|
| 2001 | 9,223 | 9,199 | 6,246 | 8,282 | 6,935 | 5,213 | 5,613 | 6,996 | 5,547 | 6,493 | 4,811 | 6,625 |
| 2002 | 8,237 | 8,719 | 9,197 | 7,344 | 6,115 | 6,321 | 4,184 | 7,865 | 6,085 | 6,264 | 7,442 | 8,179 |
| 2003 | 6,407 | 5,586 | 5,349 | 4,041 | 3,162 | 2,280 | 1,505 | 1,400 | 1,279 | 6,410 | 2,015 | 4,694 |
| 2004 | 5,947 | 6,303 | 5,074 | 4,289 | 2,798 | 2,262 | 1,946 | 1,570 | 1,779 | 2,266 | 5,077 | 4,234 |
| 2005 | 6,342 | 6,707 | 6,262 | 4,633 | 3,283 | 2,695 | 2,077 | 1,839 | 1,970 | 2,555 | 3,450 | 5,962 |
| 2006 | 5,809 | 5,421 | 5,667 | 4,242 | 3,060 | 2,599 | 2,050 | 1,868 | 2,134 | 2,718 | 3,318 | 4,431 |
| 2007 | 5,360 | 6,552 | 5,909 | 5,027 | 2,983 | 2,292 | 1,813 | 1,981 | 2,220 | 2,443 | 3,707 | 6,045 |
| 2008 | 5,500 | 5,728 | 5,571 | 4,654 | 2,762 | 2,502 | 2,307 | 2,382 | 2,235 | 2,805 | 3,658 | 4,597 |
| 2009 | 4,933 | 4,754 | 3,848 | 3,325 | 2,628 | 2,166 | 2,238 | 2,088 | 2,884 | 2,804 | 3,267 | 4,466 |
| 2010 | 5,526 | 5,841 | 3,972 | 3,246 | 2,454 | 2,300 | 2,355 | 2,621 | 2,792 | 3,379 | 4,432 | 5,319 |
| 2011 | 5,800 | 5,544 | 5,206 | 3,943 | 2,740 | 2,469 | 2,697 | 2,521 | 3,005 | 3,778 | 4,922 | 4,966 |
| 2012 | 5,178 | 5,509 | 3,771 | 3,418 | 2,463 | 2,445 | 2,232 | 2,610 | 2,945 | 3,326 | 4,745 | 5,286 |
| 2013 | 5,041 | 5,694 | 4,893 | 3,871 | 2,812 | 2,900 | 2,748 | 2,660 | 2,926 | 3,445 | 4,912 | 4,774 |
| 2014 | 5,849 | 5,746 | 5,521 | 4,098 | 3,173 | 2,625 | 2,054 | 2,591 | 2,326 | 2,838 | 3,918 | 4,841 |
| 2015 | 5,830 | 6,187 | 5,321 | 4,049 | 2,808 | 2,169 | 2,265 | 2,215 | 2,574 | 3,051 | 4,042 | 4,043 |
| 2016 | 5,581 | 5,317 | 4,604 | 4,160 | 3,161 | 2,832 | 2,466 | 2,402 | 2,481 | 3,312 | 4,191 | 5,214 |
| 2017 | 5,687 | 5,123 | 5,696 | 4,299 | 3,263 | 2,705 | 2,490 | 2,518 | 2,520 | 2,853 | 4,127 | 5,723 |
| 2018 | 5,993 | 5,231 | 5,205 | 4,840 | 3,107 | 2,835 | 2,511 | 2,508 | 2,497 | 3,566 | 4,033 | 5,197 |
| 2019 | 5,823 | 5,884 | 5,097 | 4,135 | 3,695 | 2,744 | 2,180 | 3,106 | 2,765 | 3,198 | 4,886 | 5,257 |
| 2020 | 5,813 | 5,853 | 4,692 | 4,222 | 3,159 | 2,330 | 2,516 | 2,452 | 2,573 | 3,326 | 3,729 | 5,094 |
| 2021 | 5,690 | 6,214 | 5,270 | 4,451 | 3,335 | 2,751 | 2,734 | 2,392 | 2,859 | 3,017 | 3,548 | 5,277 |
| 2022 | 6,396 | 6,197 | 5,802 | 3,602 | 3,272 | 2,966 | 2,929 | 2,680 | 2,914 | 2,974 | 3,401 | 4,552 |
| 2023 | 4,924 | 4,972 | 4,858 | 4,015 | 3,138 | 2,874 | 2,476 | 2,575 | 2,544 | 2,853 | 3,609 | 4,308 |
| 2024 | 5,001 | 5,306 | ||||||||||
| - = No Data Reported; -- = Not Applicable; NA = Not Available; W = Withheld to avoid disclosure of individual company data. |
| Release Date: 4/30/2024 |
| Next Release Date: 5/31/2024 |