|
Download Data (XLS File) |
|
||||||||
|
||||||||
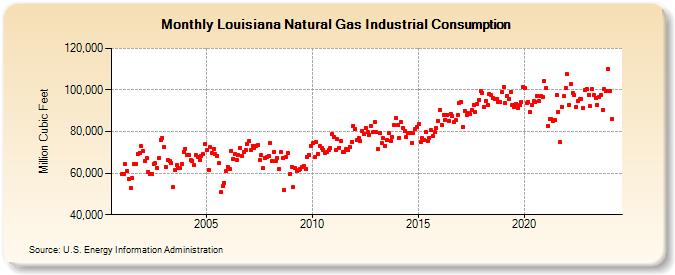
| Louisiana Natural Gas Industrial Consumption (Million Cubic Feet) | ||||||||
| Year | Jan | Feb | Mar | Apr | May | Jun | Jul | Aug | Sep | Oct | Nov | Dec |
|---|---|---|---|---|---|---|---|---|---|---|---|---|
| 2001 | 59,442 | 59,434 | 64,182 | 60,893 | 56,959 | 53,080 | 57,884 | 64,447 | 64,571 | 69,233 | 69,913 | 73,048 |
| 2002 | 70,512 | 65,911 | 67,135 | 60,540 | 59,376 | 59,591 | 64,331 | 64,681 | 62,517 | 67,104 | 76,062 | 77,070 |
| 2003 | 72,726 | 62,959 | 66,109 | 65,699 | 64,719 | 53,203 | 61,688 | 63,784 | 62,246 | 62,280 | 64,440 | 70,346 |
| 2004 | 71,841 | 68,808 | 68,634 | 66,085 | 66,036 | 63,882 | 68,547 | 67,912 | 66,218 | 68,354 | 69,066 | 73,874 |
| 2005 | 71,022 | 61,602 | 72,541 | 69,921 | 71,755 | 69,015 | 68,404 | 64,695 | 50,697 | 53,633 | 55,350 | 61,249 |
| 2006 | 62,975 | 61,941 | 70,864 | 66,764 | 69,046 | 66,491 | 68,822 | 72,286 | 68,393 | 70,332 | 71,207 | 73,813 |
| 2007 | 75,277 | 71,200 | 73,191 | 72,144 | 73,041 | 73,558 | 66,335 | 68,563 | 62,401 | 67,182 | 67,695 | 68,266 |
| 2008 | 74,601 | 65,951 | 70,246 | 65,957 | 67,356 | 62,199 | 70,160 | 67,295 | 51,988 | 67,847 | 69,601 | 59,494 |
| 2009 | 63,076 | 53,215 | 62,511 | 60,914 | 61,583 | 61,817 | 63,047 | 63,503 | 62,101 | 67,847 | 68,604 | 73,250 |
| 2010 | 74,369 | 67,545 | 75,193 | 69,359 | 72,944 | 72,193 | 71,323 | 69,492 | 70,298 | 70,977 | 71,983 | 78,858 |
| 2011 | 77,599 | 70,898 | 76,242 | 72,273 | 75,307 | 70,346 | 70,067 | 71,826 | 71,048 | 72,758 | 75,113 | 82,681 |
| 2012 | 81,179 | 75,789 | 76,833 | 75,275 | 80,282 | 78,742 | 81,948 | 79,763 | 78,491 | 82,862 | 79,763 | 84,824 |
| 2013 | 79,693 | 71,494 | 79,495 | 74,446 | 76,771 | 73,089 | 75,863 | 79,164 | 75,535 | 77,322 | 83,060 | 86,493 |
| 2014 | 83,041 | 76,982 | 84,435 | 81,868 | 80,163 | 77,414 | 79,361 | 79,443 | 74,373 | 79,353 | 81,262 | 82,338 |
| 2015 | 83,743 | 74,946 | 76,884 | 76,135 | 79,982 | 75,687 | 77,128 | 80,615 | 77,875 | 79,578 | 81,626 | 85,222 |
| 2016 | 90,371 | 83,366 | 88,194 | 85,724 | 87,931 | 85,217 | 88,601 | 87,364 | 84,510 | 85,526 | 88,053 | 93,894 |
| 2017 | 94,192 | 82,312 | 90,094 | 87,730 | 88,967 | 88,312 | 90,435 | 92,922 | 89,354 | 93,278 | 95,296 | 99,676 |
| 2018 | 98,627 | 91,759 | 94,591 | 92,901 | 97,989 | 97,377 | 96,058 | 95,551 | 95,855 | 94,256 | 93,988 | 99,119 |
| 2019 | 101,564 | 93,611 | 97,218 | 95,649 | 99,122 | 92,948 | 91,998 | 93,167 | 91,451 | 92,571 | 94,297 | 101,508 |
| 2020 | 100,824 | 93,525 | 94,003 | 89,588 | 92,962 | 94,535 | 94,337 | 97,251 | 94,643 | 96,985 | 96,555 | 104,276 |
| 2021 | 100,951 | 82,781 | 85,951 | 86,051 | 85,161 | 85,721 | 97,705 | 89,643 | 74,790 | 91,931 | 97,045 | 101,078 |
| 2022 | 107,521 | 92,965 | 102,666 | 98,764 | 97,544 | 92,040 | 94,470 | 95,433 | 95,685 | 91,540 | 99,968 | 100,572 |
| 2023 | 97,724 | 92,051 | 100,298 | 97,639 | 96,189 | 92,983 | 96,474 | 97,579 | 90,257 | 100,282 | 99,546 | 109,986 |
| 2024 | 99,467 | 85,865 | ||||||||||
| - = No Data Reported; -- = Not Applicable; NA = Not Available; W = Withheld to avoid disclosure of individual company data. |
| Release Date: 4/30/2024 |
| Next Release Date: 5/31/2024 |