|
Download Data (XLS File) |
|
||||||||
|
||||||||
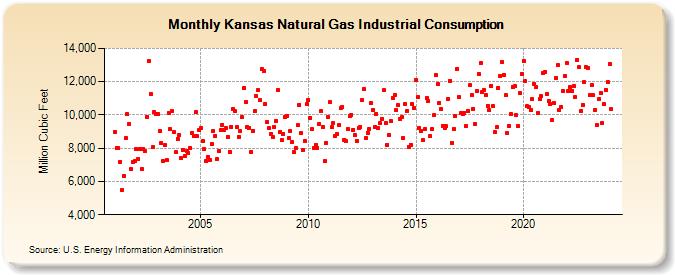
| Kansas Natural Gas Industrial Consumption (Million Cubic Feet) | ||||||||
| Year | Jan | Feb | Mar | Apr | May | Jun | Jul | Aug | Sep | Oct | Nov | Dec |
|---|---|---|---|---|---|---|---|---|---|---|---|---|
| 2001 | 9,002 | 8,035 | 8,007 | 7,187 | 5,497 | 6,335 | 8,627 | 10,037 | 9,467 | 6,721 | 7,176 | 7,259 |
| 2002 | 7,922 | 7,346 | 7,976 | 6,741 | 7,964 | 7,812 | 9,890 | 13,216 | 11,270 | 8,045 | 10,155 | 10,049 |
| 2003 | 10,045 | 9,012 | 8,326 | 7,215 | 8,177 | 7,265 | 10,127 | 9,127 | 10,209 | 8,954 | 7,754 | 8,580 |
| 2004 | 8,778 | 7,435 | 7,869 | 7,557 | 7,828 | 7,713 | 8,023 | 8,936 | 8,734 | 10,148 | 8,704 | 9,084 |
| 2005 | 9,237 | 8,405 | 7,922 | 7,223 | 7,497 | 7,294 | 8,273 | 9,035 | 8,744 | 7,335 | 7,824 | 9,092 |
| 2006 | 9,400 | 9,090 | 9,242 | 8,693 | 7,795 | 9,281 | 10,352 | 10,210 | 9,278 | 8,677 | 9,024 | 9,869 |
| 2007 | 11,631 | 10,799 | 9,270 | 9,233 | 7,781 | 9,050 | 10,210 | 11,151 | 11,479 | 10,911 | 12,738 | 12,631 |
| 2008 | 10,655 | 9,587 | 9,201 | 8,875 | 8,646 | 9,284 | 9,654 | 11,504 | 8,985 | 8,512 | 8,878 | 9,882 |
| 2009 | 9,945 | 8,608 | 9,026 | 8,362 | 7,742 | 8,032 | 9,374 | 10,625 | 8,910 | 7,870 | 8,444 | 10,631 |
| 2010 | 10,895 | 9,831 | 9,125 | 8,033 | 8,215 | 8,005 | 9,468 | 10,215 | 9,266 | 7,216 | 8,319 | 9,897 |
| 2011 | 10,760 | 9,244 | 9,503 | 8,760 | 8,843 | 9,393 | 10,390 | 10,478 | 8,515 | 8,408 | 9,150 | 9,911 |
| 2012 | 10,018 | 9,121 | 8,779 | 8,457 | 9,199 | 9,290 | 10,880 | 11,572 | 8,634 | 8,937 | 9,140 | 10,695 |
| 2013 | 10,316 | 9,284 | 10,063 | 9,209 | 9,507 | 9,781 | 11,486 | 9,507 | 8,188 | 8,781 | 9,630 | 11,024 |
| 2014 | 11,208 | 10,305 | 10,577 | 9,768 | 9,845 | 8,600 | 10,664 | 10,264 | 8,077 | 8,208 | 10,646 | 10,427 |
| 2015 | 12,075 | 11,071 | 9,199 | 9,035 | 8,466 | 9,136 | 11,029 | 10,837 | 8,723 | 9,125 | 9,972 | 12,396 |
| 2016 | 11,858 | 10,736 | 10,366 | 9,362 | 9,241 | 9,304 | 10,987 | 12,061 | 8,334 | 9,143 | 9,908 | 12,773 |
| 2017 | 11,076 | 10,112 | 10,066 | 10,141 | 9,325 | 10,251 | 11,783 | 11,175 | 10,385 | 9,479 | 11,413 | 12,448 |
| 2018 | 13,112 | 11,403 | 11,502 | 11,202 | 10,561 | 10,273 | 11,741 | 10,517 | 8,946 | 9,256 | 11,638 | 12,344 |
| 2019 | 13,194 | 12,410 | 11,180 | 8,889 | 9,325 | 10,055 | 11,707 | 11,722 | 9,986 | 9,319 | 11,321 | 12,482 |
| 2020 | 13,256 | 12,032 | 10,512 | 10,466 | 10,266 | 10,939 | 11,869 | 11,697 | 10,121 | 10,943 | 11,111 | 12,521 |
| 2021 | 12,599 | 11,240 | 10,845 | 10,662 | 9,681 | 10,724 | 12,221 | 12,974 | 10,304 | 10,470 | 11,457 | 12,332 |
| 2022 | 13,131 | 11,444 | 11,666 | 11,462 | 11,738 | 11,077 | 13,330 | 12,863 | 10,239 | 10,616 | 11,958 | 12,868 |
| 2023 | 12,808 | 11,171 | 11,787 | 11,169 | 10,303 | 9,390 | 10,948 | 11,305 | 9,511 | 10,639 | 11,505 | 11,975 |
| 2024 | 13,075 | 10,338 | ||||||||||
| - = No Data Reported; -- = Not Applicable; NA = Not Available; W = Withheld to avoid disclosure of individual company data. |
| Release Date: 4/30/2024 |
| Next Release Date: 5/31/2024 |