|
Download Data (XLS File) |
|
||||||||
|
||||||||
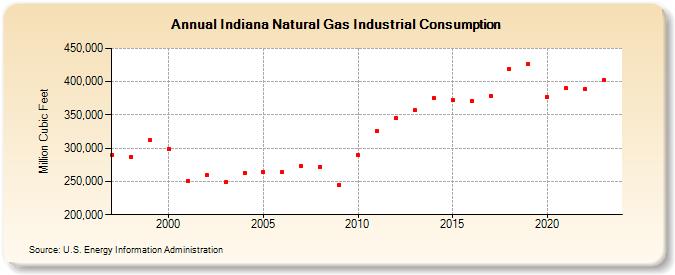
| Indiana Natural Gas Industrial Consumption (Million Cubic Feet) | ||||||||
| Decade | Year-0 | Year-1 | Year-2 | Year-3 | Year-4 | Year-5 | Year-6 | Year-7 | Year-8 | Year-9 |
|---|---|---|---|---|---|---|---|---|---|---|
| 1990's | 290,098 | 287,292 | 311,704 | |||||||
| 2000's | 298,533 | 250,766 | 259,059 | 248,666 | 262,882 | 264,020 | 263,807 | 272,551 | 272,208 | 244,975 |
| 2010's | 289,314 | 326,573 | 344,678 | 356,690 | 375,788 | 372,537 | 370,944 | 379,118 | 419,146 | 426,408 |
| 2020's | 376,913 | 389,799 | 388,827 | 401,931 |
| - = No Data Reported; -- = Not Applicable; NA = Not Available; W = Withheld to avoid disclosure of individual company data. |
| Release Date: 3/29/2024 |
| Next Release Date: 4/30/2024 |