|
Download Data (XLS File) |
|
||||||||
|
||||||||
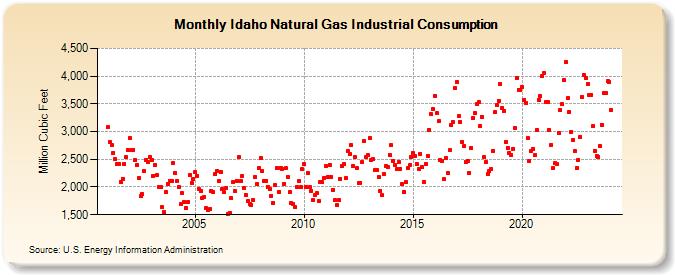
| Idaho Natural Gas Industrial Consumption (Million Cubic Feet) | ||||||||
| Year | Jan | Feb | Mar | Apr | May | Jun | Jul | Aug | Sep | Oct | Nov | Dec |
|---|---|---|---|---|---|---|---|---|---|---|---|---|
| 2001 | 3,074 | 2,803 | 2,755 | 2,621 | 2,499 | 2,410 | 2,413 | 2,093 | 2,150 | 2,413 | 2,536 | 2,669 |
| 2002 | 2,888 | 2,668 | 2,675 | 2,483 | 2,400 | 2,157 | 1,830 | 1,872 | 2,281 | 2,490 | 2,451 | 2,533 |
| 2003 | 2,492 | 2,203 | 2,403 | 2,209 | 2,008 | 2,005 | 1,632 | 1,544 | 1,909 | 2,062 | 2,109 | 2,113 |
| 2004 | 2,435 | 2,255 | 2,117 | 2,006 | 1,694 | 1,885 | 1,724 | 1,618 | 1,736 | 2,215 | 2,081 | 2,142 |
| 2005 | 2,269 | 2,201 | 1,970 | 1,920 | 1,797 | 1,822 | 1,620 | 1,587 | 1,604 | 1,925 | 1,910 | 2,226 |
| 2006 | 2,295 | 2,106 | 2,279 | 1,964 | 1,902 | 1,977 | 1,511 | 1,531 | 1,794 | 2,095 | 1,919 | 2,116 |
| 2007 | 2,532 | 2,105 | 2,195 | 1,975 | 1,850 | 1,741 | 1,697 | 1,672 | 1,761 | 2,184 | 2,061 | 2,346 |
| 2008 | 2,529 | 2,281 | 2,110 | 2,109 | 2,003 | 1,959 | 1,843 | 1,718 | 2,031 | 2,339 | 1,918 | 2,351 |
| 2009 | 2,332 | 2,059 | 2,334 | 2,188 | 1,902 | 1,710 | 1,688 | 1,638 | 1,992 | 2,102 | 1,991 | 2,320 |
| 2010 | 2,409 | 2,005 | 2,258 | 1,993 | 1,930 | 1,769 | 1,849 | 1,885 | 1,748 | 2,099 | 2,084 | 2,166 |
| 2011 | 2,378 | 2,185 | 2,399 | 2,187 | 1,948 | 1,760 | 1,672 | 1,763 | 2,152 | 2,385 | 2,407 | 2,155 |
| 2012 | 2,649 | 2,588 | 2,754 | 2,387 | 2,533 | 2,334 | 2,074 | 2,080 | 2,442 | 2,824 | 2,538 | 2,577 |
| 2013 | 2,882 | 2,486 | 2,502 | 2,300 | 2,302 | 2,183 | 1,935 | 1,851 | 2,235 | 2,378 | 2,358 | 2,582 |
| 2014 | 2,752 | 2,477 | 2,389 | 2,318 | 2,452 | 2,333 | 2,050 | 1,913 | 2,082 | 2,345 | 2,392 | 2,543 |
| 2015 | 2,607 | 2,558 | 2,419 | 2,322 | 2,598 | 2,359 | 2,091 | 2,412 | 2,561 | 3,028 | 3,311 | 3,399 |
| 2016 | 3,644 | 3,333 | 3,184 | 2,492 | 2,462 | 2,136 | 2,524 | 2,252 | 2,659 | 3,117 | 3,171 | 3,788 |
| 2017 | 3,897 | 3,273 | 3,180 | 2,817 | 2,739 | 2,453 | 2,470 | 2,259 | 2,701 | 3,248 | 3,326 | 3,492 |
| 2018 | 3,525 | 3,096 | 3,267 | 2,538 | 2,455 | 2,241 | 2,282 | 2,329 | 2,649 | 3,347 | 3,473 | 3,558 |
| 2019 | 3,855 | 3,431 | 3,374 | 2,817 | 2,710 | 2,621 | 2,570 | 2,688 | 3,070 | 3,964 | 3,751 | 3,745 |
| 2020 | 3,803 | 3,575 | 3,521 | 2,876 | 2,470 | 2,648 | 2,689 | 2,571 | 3,031 | 3,572 | 3,634 | 4,000 |
| 2021 | 4,064 | 3,540 | 3,529 | 3,032 | 2,758 | 2,348 | 2,425 | 2,412 | 2,981 | 3,384 | 3,489 | 3,927 |
| 2022 | 4,253 | 3,598 | 3,358 | 2,996 | 2,854 | 2,644 | 2,346 | 2,494 | 2,908 | 3,631 | 4,016 | 3,972 |
| 2023 | 3,859 | 3,661 | 3,664 | 3,097 | 2,657 | 2,558 | 2,543 | 2,736 | 3,123 | 3,703 | 3,689 | 3,908 |
| 2024 | 3,890 | 3,383 | ||||||||||
| - = No Data Reported; -- = Not Applicable; NA = Not Available; W = Withheld to avoid disclosure of individual company data. |
| Release Date: 4/30/2024 |
| Next Release Date: 5/31/2024 |