|
Download Data (XLS File) |
|
||||||||
|
||||||||
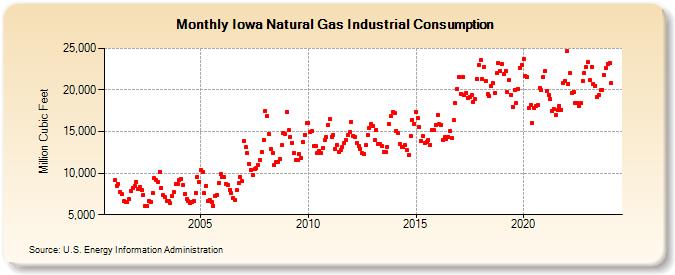
| Iowa Natural Gas Industrial Consumption (Million Cubic Feet) | ||||||||
| Year | Jan | Feb | Mar | Apr | May | Jun | Jul | Aug | Sep | Oct | Nov | Dec |
|---|---|---|---|---|---|---|---|---|---|---|---|---|
| 2001 | 9,174 | 8,509 | 8,666 | 7,687 | 7,439 | 6,610 | 6,490 | 6,582 | 6,852 | 7,846 | 8,268 | 8,465 |
| 2002 | 8,979 | 8,036 | 8,306 | 7,943 | 7,429 | 6,094 | 6,095 | 6,628 | 6,589 | 7,622 | 9,370 | 9,132 |
| 2003 | 8,957 | 10,155 | 8,270 | 7,315 | 7,108 | 6,661 | 6,665 | 6,380 | 7,288 | 7,710 | 8,640 | 8,708 |
| 2004 | 9,207 | 9,312 | 8,522 | 7,541 | 6,876 | 6,676 | 6,354 | 6,568 | 6,673 | 7,660 | 9,564 | 8,936 |
| 2005 | 10,425 | 10,143 | 7,559 | 8,502 | 6,689 | 6,817 | 6,469 | 6,068 | 7,212 | 7,426 | 8,825 | 9,870 |
| 2006 | 9,483 | 9,530 | 8,709 | 8,616 | 8,007 | 7,554 | 7,006 | 6,823 | 7,939 | 8,823 | 9,537 | 9,005 |
| 2007 | 13,855 | 13,120 | 12,382 | 11,158 | 10,435 | 9,811 | 10,474 | 10,561 | 10,988 | 11,623 | 12,527 | 13,957 |
| 2008 | 17,498 | 16,834 | 14,671 | 12,846 | 12,441 | 10,976 | 11,292 | 11,391 | 11,641 | 13,332 | 14,831 | 14,724 |
| 2009 | 17,385 | 15,137 | 14,383 | 13,659 | 12,439 | 11,547 | 11,578 | 12,259 | 11,805 | 13,732 | 14,619 | 15,969 |
| 2010 | 16,085 | 14,956 | 15,036 | 13,286 | 13,247 | 12,453 | 12,716 | 12,418 | 13,080 | 13,952 | 14,371 | 15,825 |
| 2011 | 16,496 | 14,330 | 14,573 | 12,940 | 13,360 | 12,532 | 12,778 | 13,146 | 13,584 | 13,993 | 14,596 | 14,906 |
| 2012 | 16,188 | 14,498 | 14,376 | 13,581 | 13,314 | 12,953 | 12,405 | 12,355 | 13,336 | 14,591 | 15,392 | 15,917 |
| 2013 | 15,636 | 14,026 | 15,225 | 13,532 | 13,516 | 13,220 | 12,592 | 12,551 | 13,187 | 15,865 | 16,839 | 17,356 |
| 2014 | 17,215 | 15,090 | 14,847 | 13,563 | 13,095 | 13,196 | 13,344 | 12,761 | 12,162 | 14,504 | 16,442 | 15,925 |
| 2015 | 17,368 | 16,578 | 15,493 | 13,906 | 14,433 | 13,627 | 13,797 | 13,991 | 13,428 | 15,213 | 15,136 | 15,802 |
| 2016 | 17,022 | 15,850 | 15,810 | 13,992 | 14,314 | 14,127 | 14,362 | 15,025 | 14,196 | 16,354 | 18,423 | 20,144 |
| 2017 | 21,584 | 19,560 | 21,559 | 19,343 | 19,616 | 19,040 | 19,197 | 19,411 | 18,576 | 18,925 | 21,361 | 23,014 |
| 2018 | 23,574 | 21,379 | 22,800 | 21,051 | 19,468 | 19,242 | 20,430 | 20,797 | 19,683 | 22,015 | 23,302 | 22,288 |
| 2019 | 23,113 | 21,893 | 22,317 | 19,774 | 21,140 | 19,447 | 17,994 | 20,003 | 18,406 | 20,119 | 22,669 | 23,009 |
| 2020 | 23,705 | 21,710 | 21,509 | 17,836 | 18,188 | 16,076 | 17,892 | 18,047 | 18,169 | 20,209 | 19,986 | 21,582 |
| 2021 | 22,294 | 19,880 | 19,378 | 18,862 | 17,463 | 17,724 | 16,976 | 17,538 | 18,131 | 17,634 | 20,837 | 21,065 |
| 2022 | 24,643 | 20,750 | 21,989 | 19,675 | 19,774 | 18,405 | 18,449 | 18,067 | 18,457 | 21,094 | 22,044 | 22,768 |
| 2023 | 23,317 | 21,209 | 22,797 | 20,760 | 20,531 | 19,131 | 19,438 | 19,995 | 20,039 | 21,832 | 22,647 | 23,123 |
| 2024 | 23,236 | 20,863 | ||||||||||
| - = No Data Reported; -- = Not Applicable; NA = Not Available; W = Withheld to avoid disclosure of individual company data. |
| Release Date: 4/30/2024 |
| Next Release Date: 5/31/2024 |