|
Download Data (XLS File) |
|
||||||||
|
||||||||
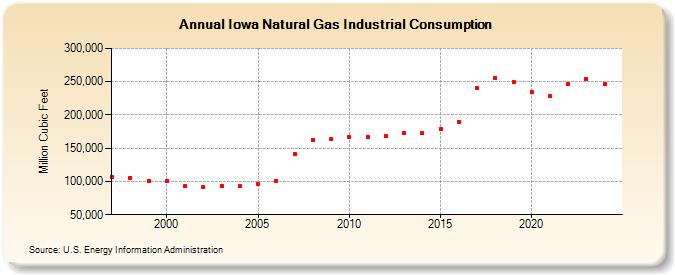
| Iowa Natural Gas Industrial Consumption (Million Cubic Feet) | ||||||||
| Decade | Year-0 | Year-1 | Year-2 | Year-3 | Year-4 | Year-5 | Year-6 | Year-7 | Year-8 | Year-9 |
|---|---|---|---|---|---|---|---|---|---|---|
| 1990's | 107,148 | 105,388 | 101,341 | |||||||
| 2000's | 100,065 | 92,589 | 92,223 | 93,856 | 93,890 | 96,007 | 101,032 | 140,892 | 162,478 | 164,512 |
| 2010's | 167,423 | 167,233 | 168,907 | 173,545 | 172,142 | 178,772 | 189,618 | 241,187 | 256,030 | 249,885 |
| 2020's | 234,909 | 227,782 | 246,115 | 254,821 |
| - = No Data Reported; -- = Not Applicable; NA = Not Available; W = Withheld to avoid disclosure of individual company data. |
| Release Date: 3/29/2024 |
| Next Release Date: 4/30/2024 |