|
Download Data (XLS File) |
|
||||||||
|
||||||||
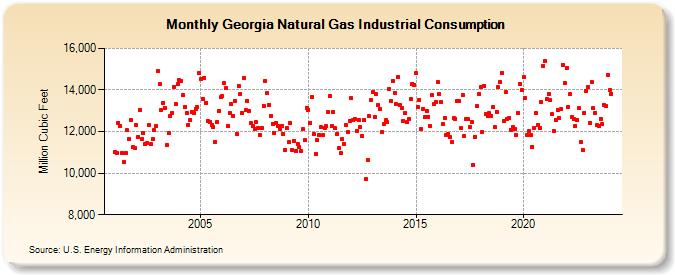
| Georgia Natural Gas Industrial Consumption (Million Cubic Feet) | ||||||||
| Year | Jan | Feb | Mar | Apr | May | Jun | Jul | Aug | Sep | Oct | Nov | Dec |
|---|---|---|---|---|---|---|---|---|---|---|---|---|
| 2001 | 11,025 | 10,991 | 12,416 | 12,284 | 10,980 | 10,558 | 10,974 | 12,062 | 11,624 | 12,533 | 11,239 | 11,212 |
| 2002 | 12,320 | 11,739 | 13,039 | 11,629 | 11,929 | 11,381 | 11,441 | 12,306 | 11,390 | 11,650 | 12,080 | 12,247 |
| 2003 | 14,903 | 14,274 | 13,044 | 13,382 | 13,121 | 11,350 | 11,925 | 12,763 | 12,912 | 14,159 | 13,309 | 14,265 |
| 2004 | 14,458 | 14,427 | 13,755 | 13,178 | 12,893 | 12,329 | 12,563 | 12,941 | 12,907 | 13,095 | 13,173 | 14,840 |
| 2005 | 14,510 | 13,587 | 14,599 | 13,397 | 12,506 | 12,465 | 12,320 | 12,209 | 11,515 | 12,461 | 12,990 | 13,642 |
| 2006 | 13,714 | 14,324 | 14,076 | 12,291 | 12,906 | 13,305 | 12,750 | 13,475 | 11,867 | 14,191 | 13,821 | 12,893 |
| 2007 | 14,589 | 13,015 | 13,471 | 12,974 | 12,388 | 12,248 | 12,099 | 12,437 | 12,177 | 11,843 | 12,180 | 13,253 |
| 2008 | 14,443 | 13,838 | 13,292 | 12,764 | 12,369 | 11,947 | 12,420 | 12,288 | 12,137 | 12,276 | 11,865 | 11,134 |
| 2009 | 12,158 | 11,474 | 12,398 | 11,118 | 11,562 | 11,061 | 11,417 | 11,252 | 11,066 | 12,105 | 11,581 | 13,134 |
| 2010 | 13,043 | 12,419 | 13,679 | 11,873 | 10,911 | 11,589 | 11,841 | 12,197 | 11,821 | 12,183 | 12,262 | 12,918 |
| 2011 | 13,713 | 12,269 | 12,933 | 12,148 | 11,899 | 11,188 | 10,949 | 11,626 | 11,397 | 12,317 | 11,977 | 12,523 |
| 2012 | 13,611 | 12,554 | 12,613 | 12,029 | 12,539 | 12,201 | 11,790 | 12,563 | 9,718 | 10,622 | 12,742 | 13,500 |
| 2013 | 13,879 | 12,703 | 13,784 | 13,284 | 13,105 | 11,969 | 12,346 | 12,534 | 12,439 | 14,037 | 13,462 | 14,441 |
| 2014 | 13,868 | 13,318 | 14,625 | 13,277 | 13,154 | 12,518 | 12,885 | 12,455 | 12,589 | 13,588 | 14,304 | 14,260 |
| 2015 | 14,803 | 13,192 | 13,537 | 12,115 | 13,089 | 12,710 | 13,006 | 12,720 | 12,274 | 13,742 | 13,324 | 13,423 |
| 2016 | 14,370 | 13,817 | 13,421 | 12,372 | 12,662 | 11,834 | 11,878 | 11,715 | 11,521 | 12,638 | 12,606 | 13,477 |
| 2017 | 13,456 | 12,169 | 13,761 | 11,785 | 12,597 | 12,581 | 12,210 | 12,477 | 10,370 | 11,754 | 13,212 | 13,800 |
| 2018 | 14,141 | 11,987 | 14,214 | 12,839 | 12,770 | 12,869 | 12,762 | 13,195 | 12,227 | 12,943 | 14,124 | 14,373 |
| 2019 | 14,832 | 12,498 | 13,890 | 12,624 | 12,660 | 12,090 | 12,210 | 12,132 | 11,857 | 12,913 | 14,295 | 13,992 |
| 2020 | 14,621 | 13,608 | 11,846 | 12,014 | 11,829 | 11,281 | 12,189 | 12,904 | 12,323 | 12,170 | 13,398 | 15,157 |
| 2021 | 15,383 | 13,571 | 13,800 | 13,516 | 12,829 | 12,008 | 12,568 | 13,045 | 12,660 | 13,061 | 15,225 | 14,338 |
| 2022 | 15,046 | 13,172 | 13,788 | 12,686 | 12,591 | 12,291 | 12,534 | 13,113 | 11,481 | 11,117 | 12,907 | 13,971 |
| 2023 | 14,136 | 12,430 | 14,393 | 13,109 | 12,900 | 12,294 | 12,271 | 12,607 | 12,305 | 13,330 | 13,233 | 14,728 |
| 2024 | 13,998 | |||||||||||
| - = No Data Reported; -- = Not Applicable; NA = Not Available; W = Withheld to avoid disclosure of individual company data. |
| Release Date: 3/29/2024 |
| Next Release Date: 4/30/2024 |