|
Download Data (XLS File) |
|
||||||||
|
||||||||
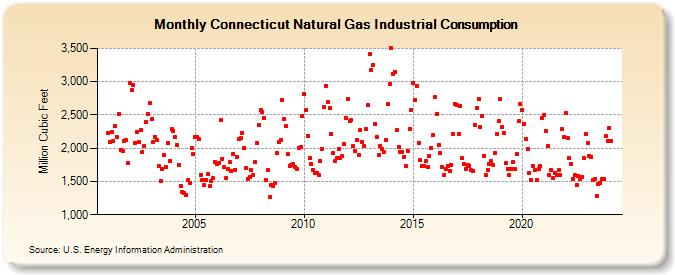
| Connecticut Natural Gas Industrial Consumption (Million Cubic Feet) | ||||||||
| Year | Jan | Feb | Mar | Apr | May | Jun | Jul | Aug | Sep | Oct | Nov | Dec |
|---|---|---|---|---|---|---|---|---|---|---|---|---|
| 2001 | 2,225 | 2,099 | 2,243 | 2,115 | 2,331 | 2,168 | 2,517 | 1,977 | 1,952 | 2,104 | 2,118 | 1,773 |
| 2002 | 2,982 | 2,873 | 2,953 | 2,080 | 2,249 | 2,098 | 2,273 | 1,936 | 2,029 | 2,388 | 2,516 | 2,673 |
| 2003 | 2,442 | 2,098 | 2,170 | 2,119 | 1,737 | 1,511 | 1,686 | 1,897 | 1,715 | 2,072 | 1,813 | 2,294 |
| 2004 | 2,264 | 2,166 | 2,044 | 1,742 | 1,431 | 1,342 | 1,330 | 1,300 | 1,519 | 1,483 | 2,003 | 1,906 |
| 2005 | 2,172 | 2,173 | 2,136 | 1,602 | 1,527 | 1,448 | 1,520 | 1,613 | 1,427 | 1,506 | 1,546 | 1,799 |
| 2006 | 1,761 | 1,779 | 2,422 | 1,844 | 1,711 | 1,553 | 1,690 | 1,791 | 1,654 | 1,917 | 1,679 | 1,868 |
| 2007 | 2,134 | 2,150 | 2,233 | 2,010 | 1,701 | 1,534 | 1,562 | 1,668 | 1,591 | 1,791 | 2,074 | 2,347 |
| 2008 | 2,578 | 2,543 | 2,447 | 1,524 | 1,674 | 1,266 | 1,449 | 1,439 | 1,477 | 1,929 | 2,087 | 2,126 |
| 2009 | 2,730 | 2,444 | 2,335 | 1,911 | 1,725 | 1,754 | 1,761 | 1,718 | 1,685 | 2,008 | 2,025 | 2,488 |
| 2010 | 2,810 | 2,581 | 2,188 | 1,849 | 1,758 | 1,666 | 1,623 | 1,632 | 1,591 | 1,811 | 1,992 | 2,616 |
| 2011 | 2,940 | 2,692 | 2,598 | 2,215 | 1,924 | 1,800 | 1,845 | 1,992 | 1,854 | 1,877 | 2,067 | 2,455 |
| 2012 | 2,744 | 2,408 | 2,417 | 2,038 | 1,960 | 2,128 | 1,902 | 2,275 | 2,094 | 2,031 | 2,282 | 2,654 |
| 2013 | 3,409 | 3,172 | 3,253 | 2,361 | 2,165 | 1,905 | 2,040 | 1,981 | 1,939 | 2,123 | 2,658 | 2,960 |
| 2014 | 3,499 | 3,120 | 3,147 | 2,267 | 2,015 | 1,950 | 1,949 | 1,868 | 1,734 | 1,961 | 2,289 | 2,571 |
| 2015 | 2,978 | 2,728 | 2,936 | 2,082 | 1,816 | 1,733 | 1,736 | 1,804 | 1,712 | 1,883 | 2,010 | 2,194 |
| 2016 | 2,763 | 2,517 | 2,044 | 1,921 | 1,714 | 1,602 | 1,685 | 1,733 | 1,663 | 1,745 | 2,213 | 2,671 |
| 2017 | 2,644 | 2,217 | 2,632 | 1,849 | 1,756 | 1,691 | 1,750 | 1,737 | 1,665 | 1,664 | 2,348 | 2,604 |
| 2018 | 2,744 | 2,312 | 2,490 | 1,883 | 1,595 | 1,676 | 1,764 | 1,803 | 1,747 | 1,925 | 2,220 | 2,404 |
| 2019 | 2,734 | 2,325 | 2,233 | 1,777 | 1,691 | 1,590 | 1,693 | 1,792 | 1,686 | 1,917 | 2,416 | 2,667 |
| 2020 | 2,571 | 2,368 | 2,143 | 1,987 | 1,629 | 1,524 | 1,727 | 1,667 | 1,517 | 1,694 | 1,734 | 2,458 |
| 2021 | 2,502 | 2,263 | 2,039 | 1,590 | 1,674 | 1,546 | 1,633 | 1,593 | 1,666 | 1,598 | 2,281 | 2,166 |
| 2022 | 2,532 | 2,156 | 1,853 | 1,763 | 1,540 | 1,599 | 1,443 | 1,579 | 1,535 | 1,566 | 1,856 | 2,219 |
| 2023 | 2,084 | 1,886 | 1,874 | 1,515 | 1,542 | 1,283 | 1,455 | 1,480 | 1,532 | 1,534 | 2,180 | 2,106 |
| 2024 | 2,302 | 2,108 | ||||||||||
| - = No Data Reported; -- = Not Applicable; NA = Not Available; W = Withheld to avoid disclosure of individual company data. |
| Release Date: 4/30/2024 |
| Next Release Date: 5/31/2024 |